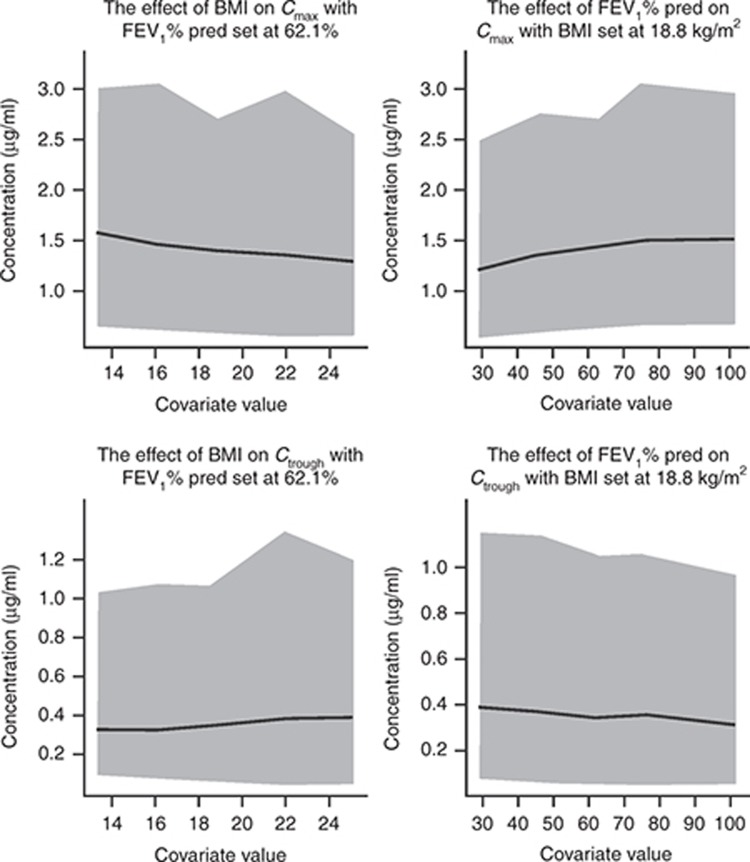
Figure 2.
Effect of the covariates body mass index (BMI) and forced expiratory volume in 1 s as percent of the predicted value (FEV1% pred) at baseline on tobramycin serum Cmax and Ctrough with 95% predictive interval (PI)*, assuming a typical cystic fibrosis patient with FEV1% predicted of 62.1% and BMI of 18.8 kg/m2. Gray area represents 95% PI, and solid line represents mean tobramycin concentration. *Obtained by simulation with interindividual variability in pharmacokinetics; PI values are presented for each covariate value, not for the slope of best fit. Cmax, maximum plasma concentration at steady state; Ctrough, trough plasma concentration at steady state.

