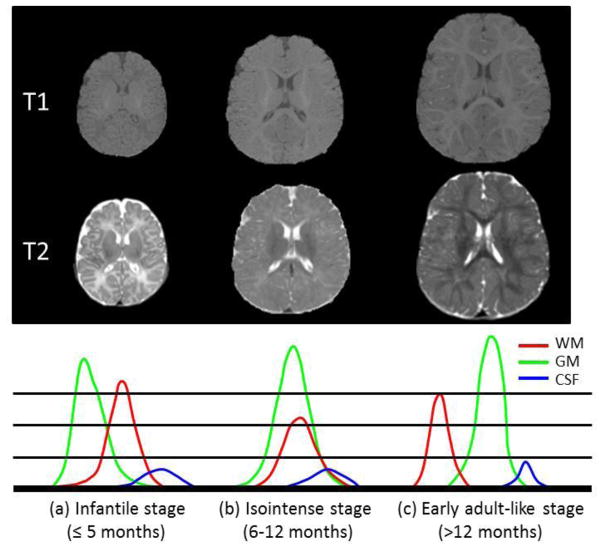
Fig. 1.
Illustration of three distinct stages in infant brain development, with each stage having quite different WM/GM contrast patterns in MR images. The corresponding tissue intensity distributions from T2-weighted MR images are shown in the bottom row, which indicates high overlap of WM and GM intensities in the isointenste stage.

