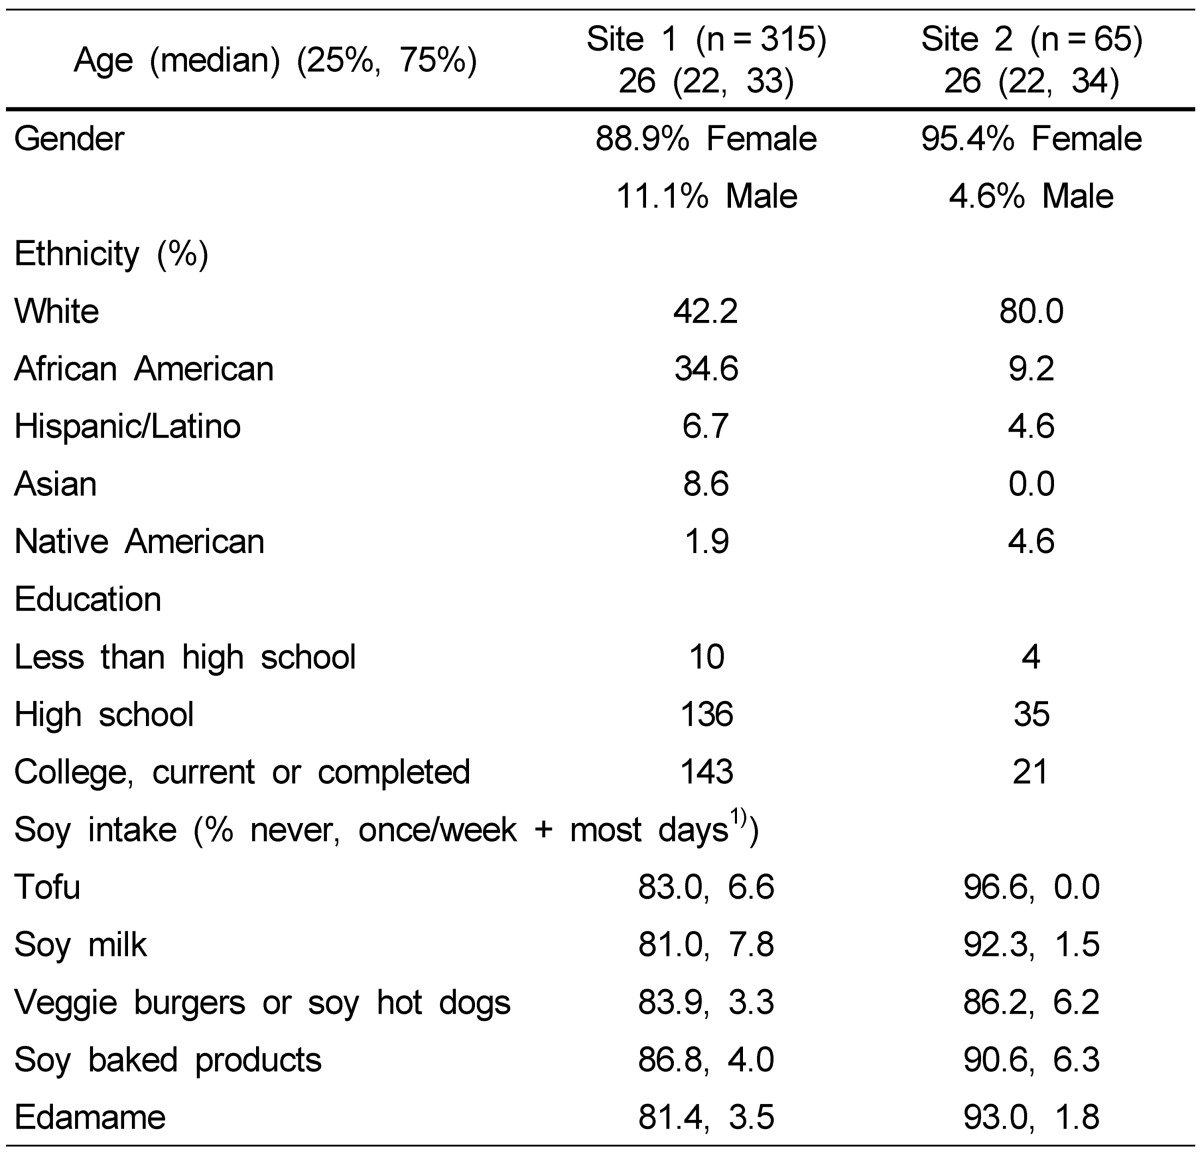
Table 4.
Participant demographics and consumption of soy products

1)Does not equal 100% as other categories included several times a year, once per month, 2-3 times.
Per month; however, the 2 categories above describe most intake.
Participant demographics and consumption of soy products

1)Does not equal 100% as other categories included several times a year, once per month, 2-3 times.
Per month; however, the 2 categories above describe most intake.