
Figure 4.
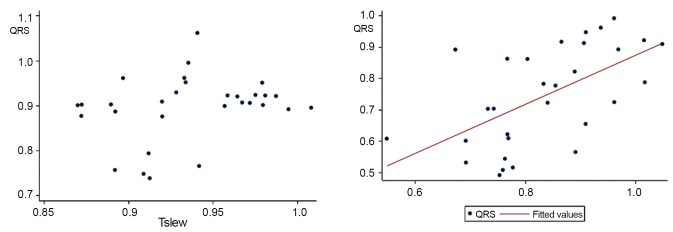
Correlation of the QRS amplitude and the maximum slope of the descending T wave. (A) No linear correlation was observed between the QRS amplitude and the maximum slope of the descending T wave in the isograft group (r=0.2639, P=0.1587); (B) Linear correlation between the QRS amplitude and the maximum slope of the descending T wave in the allograft group (r=0.5816, P=0.0007).