
Figure 5.
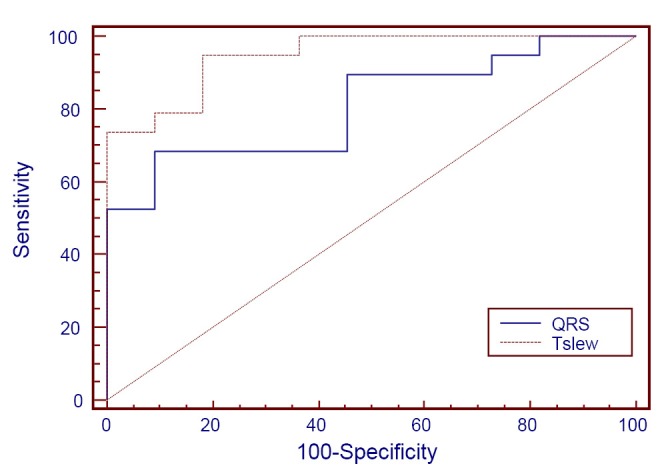
Areas under the ROC curves of the QRS amplitude and the maximum slope of the descending T wave: significantly differed (χ2 =4.32, P=0.0377).
Official websites use .gov
A
.gov website belongs to an official
government organization in the United States.
Secure .gov websites use HTTPS
A lock (
) or https:// means you've safely
connected to the .gov website. Share sensitive
information only on official, secure websites.
Areas under the ROC curves of the QRS amplitude and the maximum slope of the descending T wave: significantly differed (χ2 =4.32, P=0.0377).