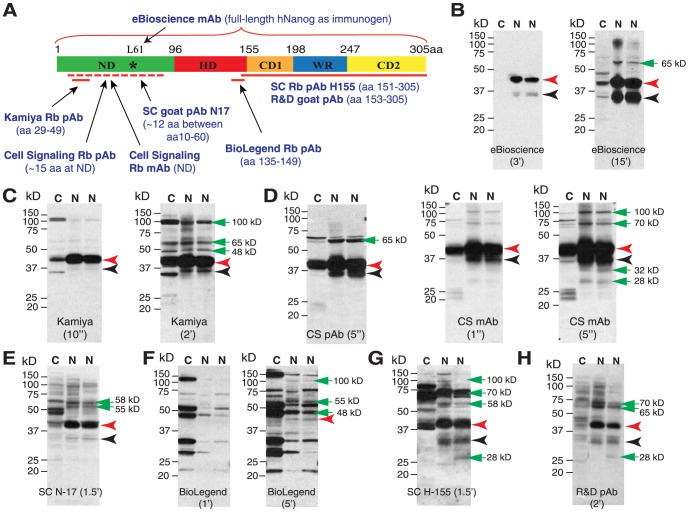
Figure 1. WB analysis of endogenous Nanog1 protein species in NTERA-2 cells.
(A) Schematic of the human Nanog protein and 8 anti-Nanog Abs used in this study. Shown in parentheses are epitopes of individual Abs. ND, N-terminus domain; HD, homeodomain; CD1 and CD2, C-terminus domain 1 and 2; WR, tryptophan-rich domain. The asterisk in ND indicates the Leu61 residue recognized by the eBioscience mAb (arrow) mapped from our present studies. (B–H) WB analysis in NTERA-2 NE (N, two different batches) or cytosol (C) using 8 anti-Nanog Abs. Individual Ab is indicated at the bottom and M.W on the left. Black arrowhead, the predicted 35 kD Nanog protein; red arrowhead, the main 42 kD band; green arrows, additional bands (especially after longer exposures).

