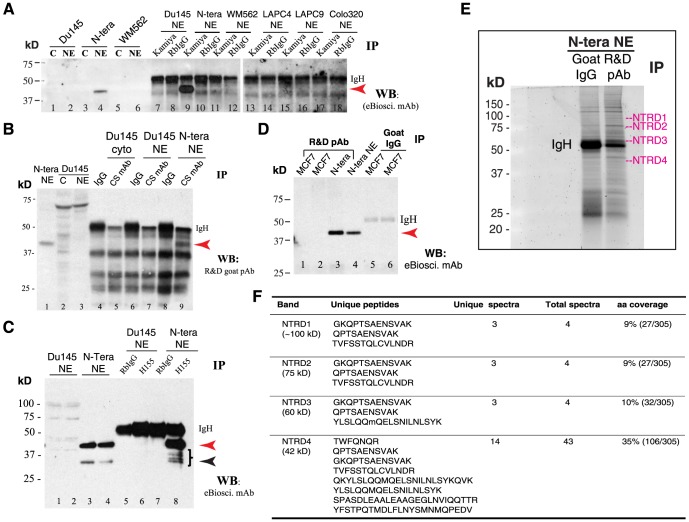
Figure 3. IP and ID studies with 5 anti-Nanog antibodies in NTERA-2 and cancer cells.
(A) The NE of NTERA-2 and various cancer cells was used in IP with the Kamiya anti-Nanog Rb pAb followed by WB with the eBioscience mAb. Lanes 1-6 were regular WB with either cytosol (C) or NE. Red arrowhead, the 42 kD Nanog band; IgH, IgG heavy chain (∼53 kD). Note that the prominent 42 kD protein band was detected on WB (lane 4) and immunoprecipitated down (lane 9) only in NTERA-2 NE. (B) The NTERA-2 NE or Du145 cytosol (cyto) or NE was used in IP with the CS anti-Nanog rabbit mAb followed by WB with the R&D goat pAb. Lanes 1-3 were regular WB. Red arrowhead, the 42 kD Nanog band; IgH, IgG heavy chain. Note that the 42 kD Nanog protein was detected on WB (lane 1) and immunoprecipitated down (lane 9) only in NTERA-2 NE. (C) The NE of NTERA-2 and Du145 cells was used in IP with the SC anti-Nanog rabbit pAb H155 followed by WB with eBioscience mAb. Lanes 1–4 were regular WB using two independent preparations of Du145 or NTERA-2 NE. Red arrowhead, the 42-kD band; black arrowhead, the 35-kD Nanog band; IgH, IgG heavy chain. Note that the 42-kD protein band was detected on WB (lane 3 and 4) and immunoprecipitated down (lane 8) only in NTERA-2 NE. The right-pointing bracket indicates the cluster of Nanog protein bands below the dominant 42 kD band. (D) The NE of NTERA-2 cells and MCF7 cells (two independent preparations) was used in IP with the R&D anti-Nanog goat pAb (goat IgG used as the control) followed by WB with the eBioscience mAb. Red arrowhead, the 42 kD Nanog band; IgH, IgG heavy chain. Note that the 42-kD protein band was detected on WB (lane 4; input) and immunoprecipitated down (lane 3) only in NTERA-2 NE. (E–F) Nanog protein ID by MALDI-TOF/TOF in NTERA-2 NE following IP using the R&D goat pAb. Shown are SYPRO Ruby gel image (E; NTRD1-4 refer to the 4 gel slices cut out for protein elution) and the Nanog peptides recovered from each gel slice (F).

