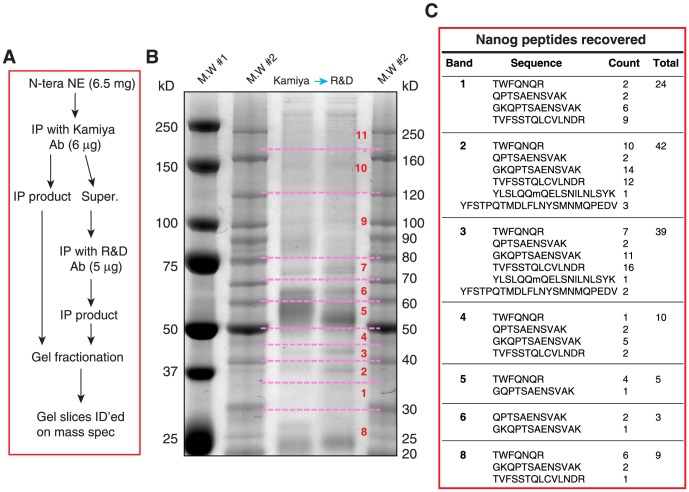
Figure 4. Mass spectrometry analysis of Nanog peptides recovered from NTERA-2 NE.
(A) Flow chart of tandem IP and the sample preparation for LTQ mass spec analysis. (B) The gel image of SYPRO Ruby staining. The NE from NTERA-2 cells was used to perform the tandem IP with two anti-Nanog antibodies (i.e., Kamiya rabbit pAb and R&D goat pAb). The immunoprecipitates were separated by SDS-PAGE and the gel was stained with SYPRO Ruby. Gel slices as indicated (dashed lines and numbers) were cut out to elute proteins for LTQ mass spectrometry analysis. M.W#1 and M.W#2 were two protein markers. (C) Nanog peptides (sequences and total counts indicated) recovered for each gel slice.

