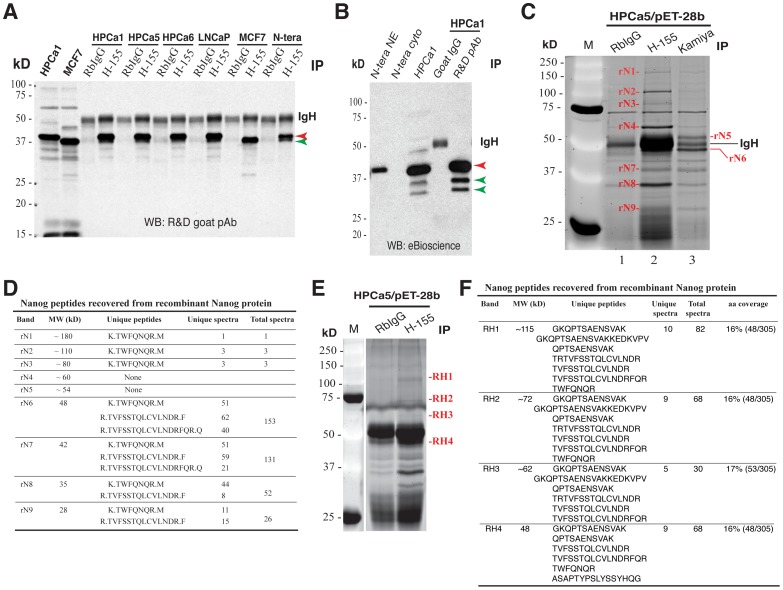
Figure 7. rNanogP8 protein ID using IP and mass spectrometry.
(A) IP in rNanogP8 proteins using the SC pAb H-155 followed by WB using the R& D goat pAb. RbIgG was used as the control Ab. Red arrowhead, the 42 kD band; green arrowhead, the faster migrating major band in MCF7 rNanogP8; IgH, IgG heavy chain. (B) IP using the R&D goat pAb followed by WB using the eBioscience mAb. Goat IgG was used as the control Ab. Red arrowhead, the 42 kD band; green arrowheads, the two lower bands; IgH, IgG heavy chain. In this experiment, NTERA-2 NE and cytosol and HPCa rNanogP8 were also loaded in WB analysis. (C–D) Mass spectrometry ID of rNanogP8 proteins. The HPCa5 rNanogP8 protein made in pET-28b was used in IP with either H-155 or Kamiya Rb pAb (RbIgG as the Ab control). The immunoprecipitates were subjected to SDS-PAGE, stained with SYPRO Ruby, and 9 bands (rN1 - rN9) cut out for protein ID (C). M, protein marker. The identified peptides were presented in D. (E–F) Mass spectrometry ID of rNanogP8 proteins in a separate experiment using conditions as above. Four bands (RH1–RH4) were cut out for protein ID (E) and identified peptides presented in F.

