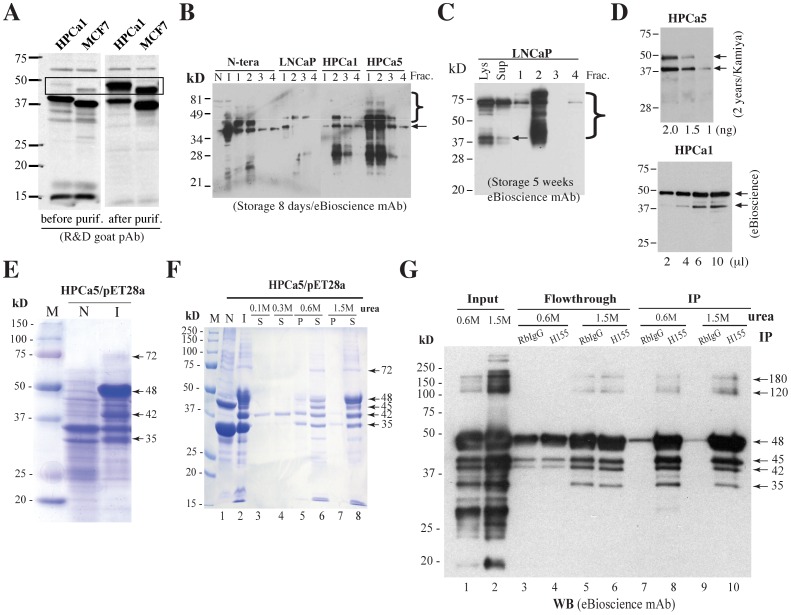
Figure 8. Evidence that rNanogP8 proteins can spontaneously form high M.W species.
(A) rNanogP8 proteins from HPCa1 and MCF7, before and after purification, were used in WB using the R&D goat pAb. Note that prior to purification, the HPCa1 and MCF7 rNanogP8 proteins migrated at ∼42 kD and ∼37 kD, respectively, with a minor upper band detected for both proteins. After purification, the intensity of the upper bands (in the rectangle) became significantly stronger. (B–C) rNanogP8 proteins (from the indicated cell types) stored at −80°C for 8 days (B) or 5 weeks (C) were used in protein purification. Aliquots (20 µl) of 4 fractions (Frac.) for each sample, together with NTERA-2 non-induced (N) or induced (I) bacterial lysate (B) or LNCaP total bacterial lysate (Lys) or supernatant (Sup) (C), were used in WB with the eBioscience mAb. The arrows indicate the ∼42 kD rNanogP8 proteins and right-hand brackets indicate high M.W ladders. (D) The HPCa5 and HPCa1 rNanogP8 proteins stored for 2 years was utilized in WB with the Kamiya pAb and eBioscience mAb, respectively. (E) Coomassie brilliant blue R-250 staining of rNanogP8 protein made from HPCa5 cDNA in pET-28a. The arrows indicate the high levels of rNanogP8 proteins under the induced conditions. M, protein marker; N, non-induced; I, induced by IPTG. (F) Coomassie brilliant blue R-250 staining of HPCa5 rNanogP8 proteins from refolding dialysis experiment. The inclusion bodies of rNanogP8 protein were first dissolved in 7 M urea and then subjected to dialysis against decreasing concentrations of urea. N, non-induced; I, induced by IPTG; S, soluble portion; P, pellet (precipitated portion). Arrows indicate rNanogP8 proteins of different molecular weights. (G) IP analysis confirms that the refolded bands are rNanogP8. The dialysis samples containing 1.5 M or 0.6 M urea were subjected to IP with the SC pAb (H-155) or RbIgG (control) followed by WB analysis with the eBioscience mAb. Arrows indicate rNanogP8 proteins of different molecular weights.

