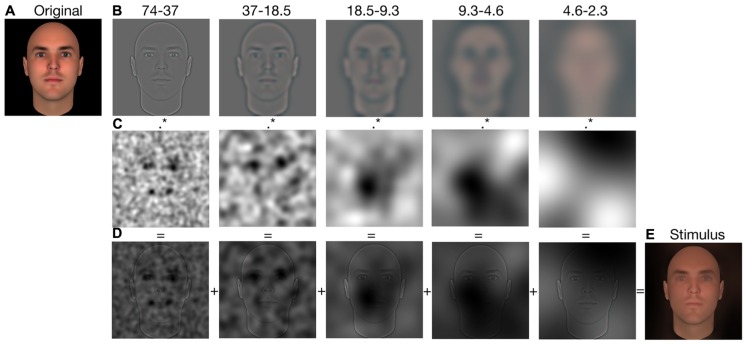
FIGURE 4.
Illustration of the stimulus-generation process for Experiment 2. Each original stimulus (A) was first decomposed into five spatial-frequency bandwidths (B). Each bandwidth was then independently multiplied by the respective SCI (C). The resulting visual information were summed across the five scales (D) to produce a filtered stimulus (E).

