
Figure 3.
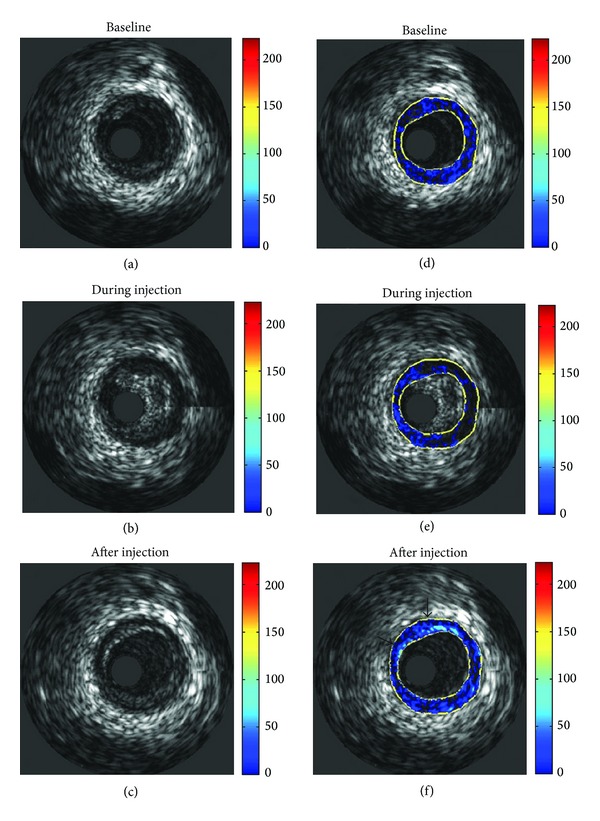
Depiction of qualitative representation of enhancement. Unprocessed images are displayed (a) before, (b) during, and (c) after injection of microbubbles. Corresponding processed images are displayed in (d)–(f). Enhancement is graded from minimal (blue) to maximal (red). Values are a percentage of the maximum grey level intensity difference (255). Arrows indicate points of intense, stable enhancement at the media-adventitia border. Diffuse points of enhancement are present nearby. Reprint with permission from [53].