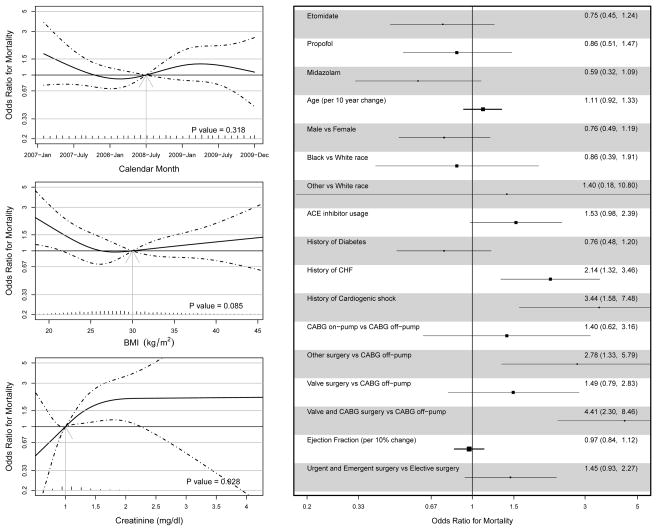
Fig. 4.
In Hospital Mortality Regression Analysis: Results are based on a multivariable logistic regression model, and odds ratios (OR) and 95% confidence intervals summarize the relative odds of mortality during the hospitalization. Calendar month, body mass index (BMI) and creatinine concentration were entered into the regression model flexibly using restricted cubic splines with four knots. To display effects sizes for the nonlinear effects, we chose a single reference value for each variable (calendar month = July 2008, BMI = 30 kg/m2, creatinine concentration = 1 mg/dl) and compared all other values to it. Due to lack of evidence suggesting a nonlinear relationship with any of the outcomes, the other continuous variables (age and ejection fraction) were modeled with linear terms and are included on the right with categorical variables. Categorical variables effects characterize the adjusted association between the outcome and the presence (vs. absence) of the risk factor. ACE = angiotensin-converting enzyme; CABG = coronary artery bypass graft; CHF = congestive heart failure.

