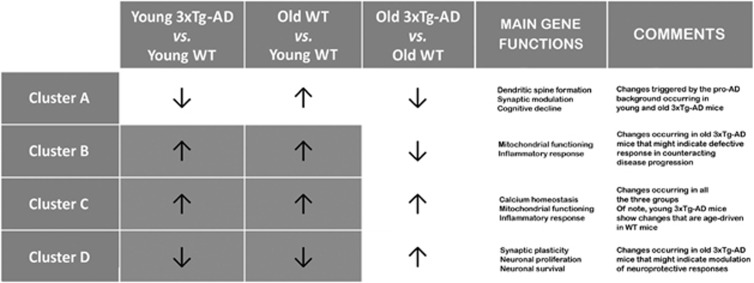
Figure 4.
Graphical synopsis of cluster analysis results. Synoptic view of all the transcriptome profiles that were found altered in the three experimental conditions. The main findings associated with observed gene expression changes are summarized. Note that, as depicted by the dark gray boxes, 3 m.o. 3xTg-AD versus 3 m.o. WT mice as well as 12 m.o. WT versus 3 m.o. WT mice show a similar pattern of expression changes in clusters B, C, and D. Also note that, only in the case of genes of cluster C, a common pattern of expression profiles is observed across all the three experimental conditions

