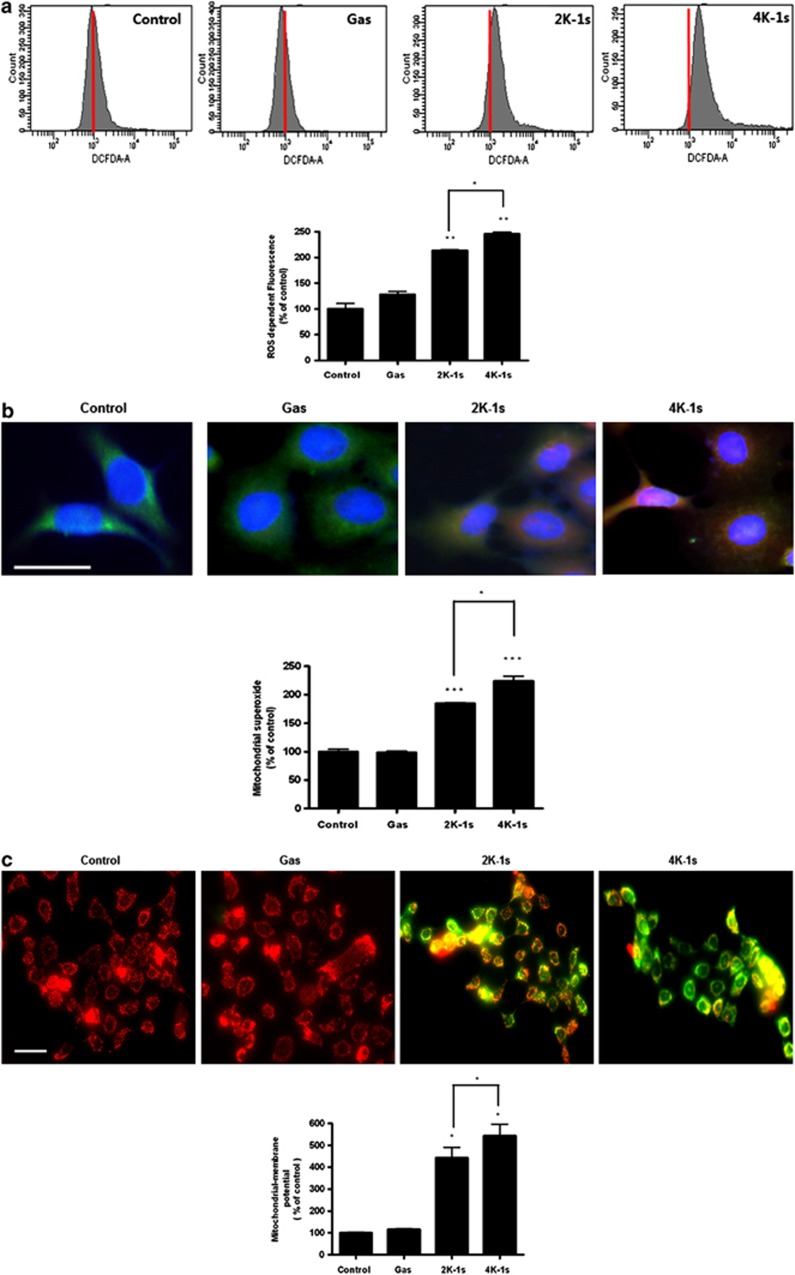
Figure 2.
Induction of ROS in NTP-treated FaDu cells. (a) FaDu cells were treated with DCFDA and assayed using flow cytometry. (b) For measurement of mitochondrial superoxide, the cells were incubated with 2.5 μM of MitoSOX and then stained with 180 nM MitoTracker. (c) MMP was measured by flow cytometry using JC-1 fluorescence. Scale bar denotes 50 μm. *P<0.05, **P<0.01, and ***P<0.001

