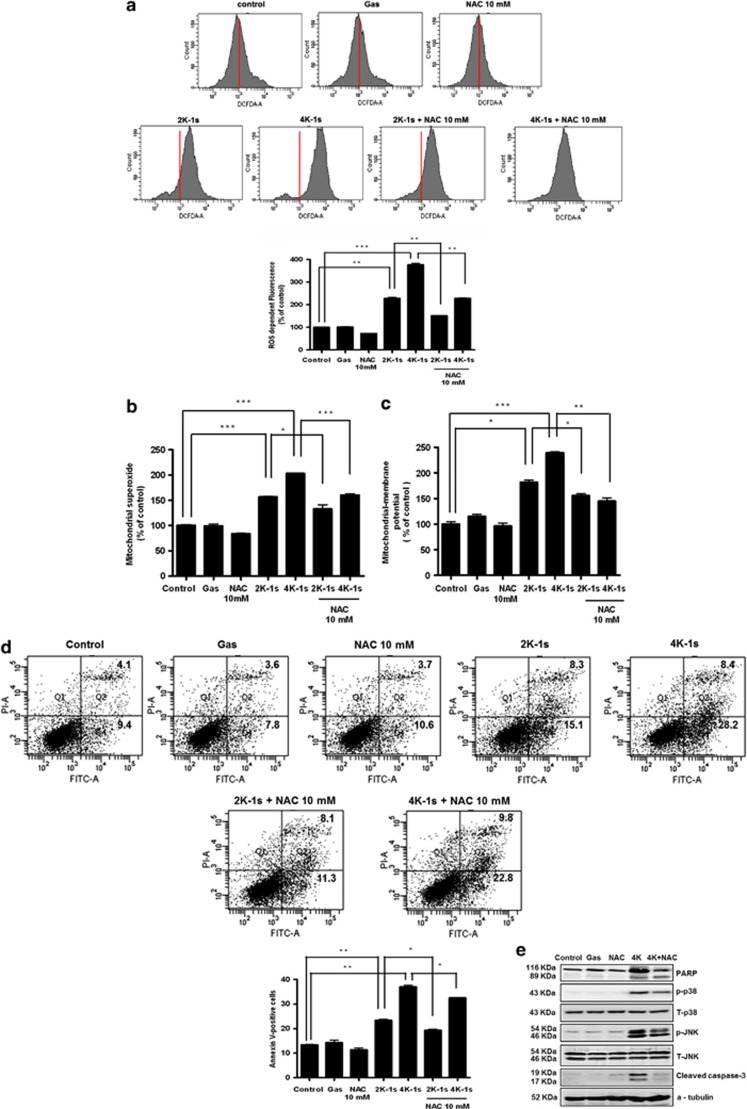
Figure 3.
Effect of NTP-generated ROS on apoptosis. Cells were treated with NAC (10 mM) for 1 h before treatment with NTP. (a) Measurement of ROS generation using flow cytometry. (b) Measurement of mitochondrial superoxide with MitoSOX and MitoTracker. (c) Measurement of MMP with JC-1. (d) Analysis of apoptosis by FACS with Annexin V-PI. (e) The cell lysates were assessed by western blot analysis using antibodies against p-JNK, p-p38, p-ERK, cleaved caspase-3, and PARP. *P<0.05, **P<0.01, and ***P<0.001

