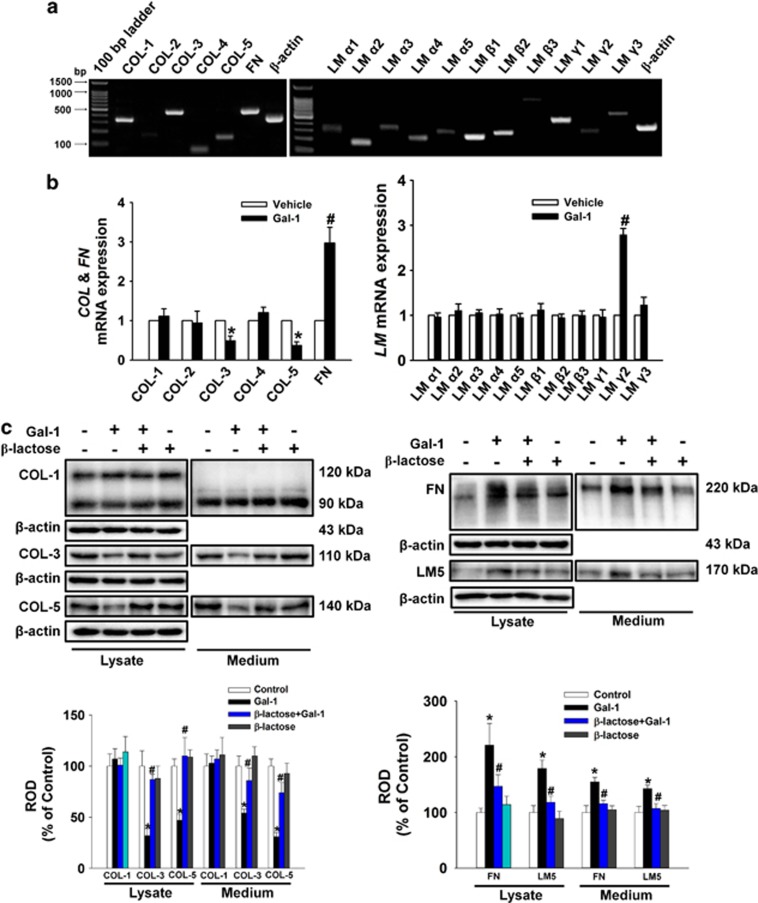
Figure 2.
Effects of Gal-1 on ECM protein expression. (a) Total RNA from cells was reverse transcribed, and ECM cDNAs were amplified by PCR as described in the Materials and Methods. The example shown is representative of five independent experiments. (b) Cells were treated with 10 ng/ml Gal-1 for 12 h. The mRNA expression of ECM components was measured in cells using real-time PCR as described in the Materials and Methods. The data are reported as the mean±S.E. of four independent experiments, each conducted in triplicate. *P<0.05 versus vehicle. (c) The cells were pretreated with β-lactose (10 mM) for 30 min before 10 ng/ml Gal-1 treatment for 24 h. Total protein was extracted and blotted with COL-1, COL-3, COL-5, FN, and LM-5 antibody. Each example shown is representative of five independent experiments. The lower or right part of (c) depicting the bars denotes the mean±S.E. of five independent experiments for each condition determined by densitometry relative to β-actin. *P<0.05 versus control, #P<0.05 versus Gal-1 alone. COL, collagen; ECM, extracellular matrix; FN, fibronectin; LM, laminin; ROD, relative optical density

