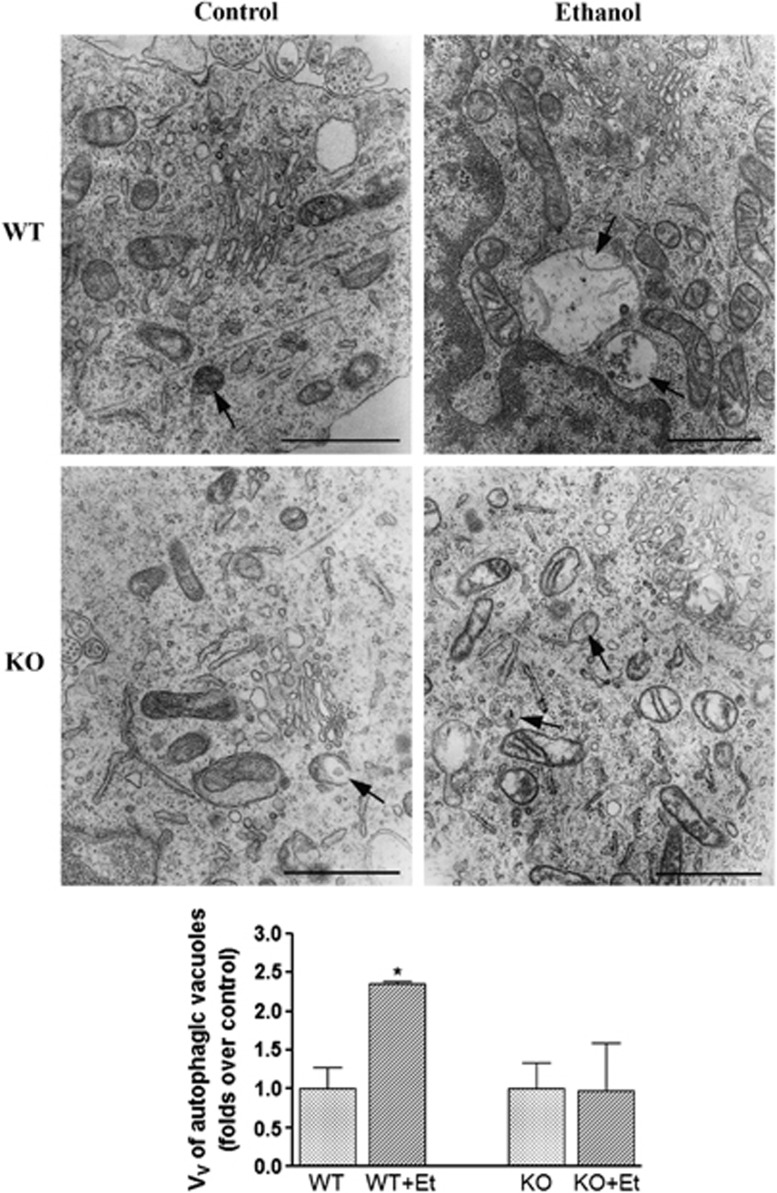
Figure 4.
The electron microscopy analysis shows that chronic ethanol consumption increases the volume density of autophagic vacuoles in WT mice. The representative transmission electron micrographs of the cerebral cortices obtained from the ultrathin tissue sections of the WT and TLR4-KO mice treated or not with ethanol for 4 months is shown. Bars represent the volume density (Vv) of autophagic vacuoles (μm3/100 μm3 per cell). Scale bars represent 1 μm. Arrows indicate autophagic vacuoles. Data represent mean±S.E.M., n=3–4 mice/group. *P<0.05 as compared with the ethanol-treated WT or TLR4-KO mice with their respective untreated control groups, according to an unpaired Student's t-test

