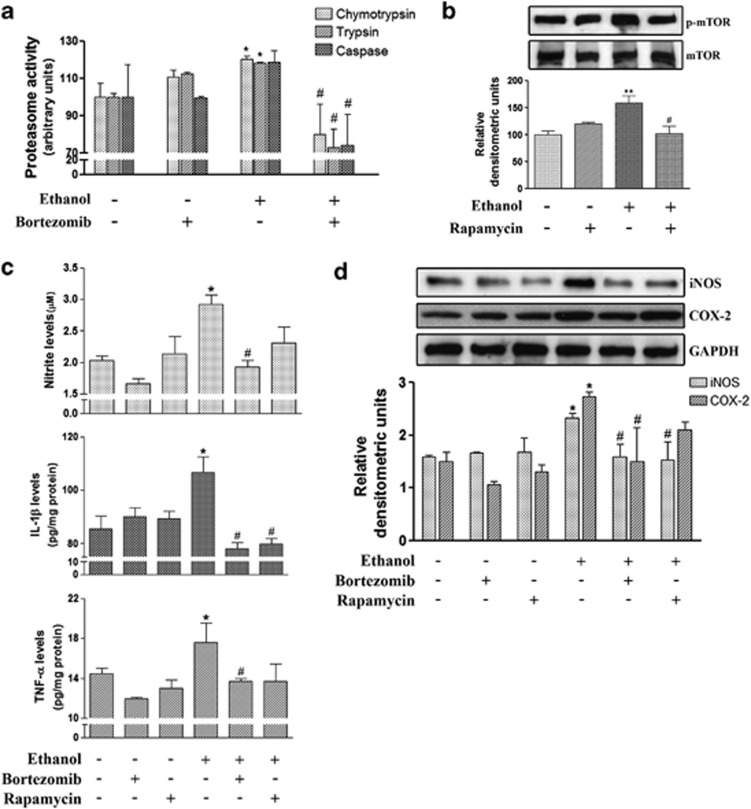
Figure 5.
Effect of the in vivo administration of bortezomib and rapamycin to ethanol-treated WT mice. (a) Levels of the three proteolytic activities, chymotrypsin-like, trypsin-like and caspase-like, in the brain cortical extracts of these groups: control; ethanol exposure (4 months); bortezomib (1 mg/kg); ethanol exposure (4 months) plus bortezomib (1 mg/kg). (b) The immunoblot analysis and quantification of the expression of p-mTOR in the brain cortical extracts of these groups: control; ethanol exposure (4 months); rapamycin (3 mg/kg); ethanol exposure (4 months) plus rapamycin (3 mg/kg). The levels of TNF-α, IL-1β and NO (c) and the immunoblot analysis and quantification of COX-2 and iNOS (d) were measured in the extracts of the brain cortices of these groups: control; ethanol exposure (4 months); rapamycin (3 mg/kg); bortezomib (1 mg/kg); ethanol exposure (4 months) plus rapamycin (3 mg/kg); ethanol exposure (4 months) plus bortezomib (1 mg/kg). Rapamycin or bortezomib was administered once weekly intraperitoneally or intravenously, respectively. Data represent mean±S.E.M., n=4–6 mice/group. *P<0.05, **P<0.01 as compared with the control group, #P<0.05 as compared with the ethanol group, according to the one-way ANOVA followed by the Bonferroni's post hoc test. Blots were stripped, and the total quantity of GAPDH was also assessed. A representative immunoblot of each protein is shown

