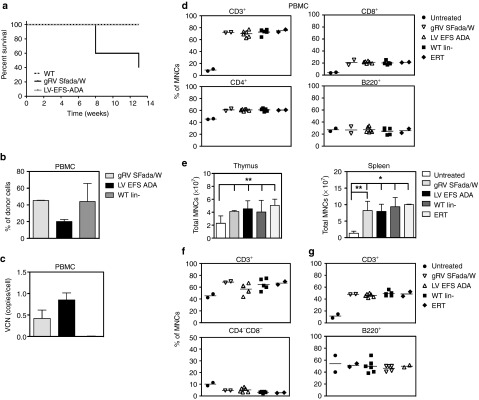
Figure 2.

Survival rate, peripheral blood (PB) analysis, and immunophenotype of ADA−/− recipients. (a) Survival: Kaplan–Meier curves of ADA−/− recipients were transplanted with transduced ADA−/− BM Lin- cells (LV EFS ADA, n = 6) and gRVSFada/W (SFada/W, n = 5), respectively, at a multiplicity of infection (MOI) of 20. Control mice were injected with untransduced BM Lin- cells from ADA+/+ donors (WT Lin-, n = 5). All LV EFS ADA and WT mice were alive at 13 weeks compared to gRVSFada/W group, where two mice died at 7 weeks and one died at 12 weeks with the remaining two alive at 13 weeks (P = 0.02). All surviving mice were euthanized for analysis unless otherwise indicated. (b) Percentage of donor cells in total PB mononuclear cells (PBMCs) by quantitative PCR (qPCR). (c) Vector copy number (VCN) in PBMCs of transplanted ADA−/− mice. Percentage of DNA with Y chromosome were evaluated in sex-mismatched transplants indicated in 1a (Mean ± SD). (d) FACS analysis of circulating mature T and B cells in peripheral blood of ADA−/− transplants. Untreated ADA−/− mice (untreated, 18 days old, n = 2) and 4–5 months old PEG-ADA treated ADA−/− mice (ERT, n = 2) were analyzed as controls. Data are displayed as percentage of CD3+, CD4+, CD8+, and B220+ cells in PBMCs. Horizontal bars indicate the average values. (e) Total mononucleated cell counts in thymi and spleens (*P < 0.001; **P < 0.05). Results are given as Mean ± SD. (f) FACS analysis of thymocytes of ADA−/− recipients and control mice. Data are presented as percentage of total CD3+ and CD4−CD8− cells in mononucleated cells. Horizontal bars indicate the average values. (g) FACS analysis of splenocytes in ADA−/− recipients and control mice. Data are presented as percentage of CD3+ and B220+ cells in total mononucleated cells. Horizontal bars indicate the average values.
