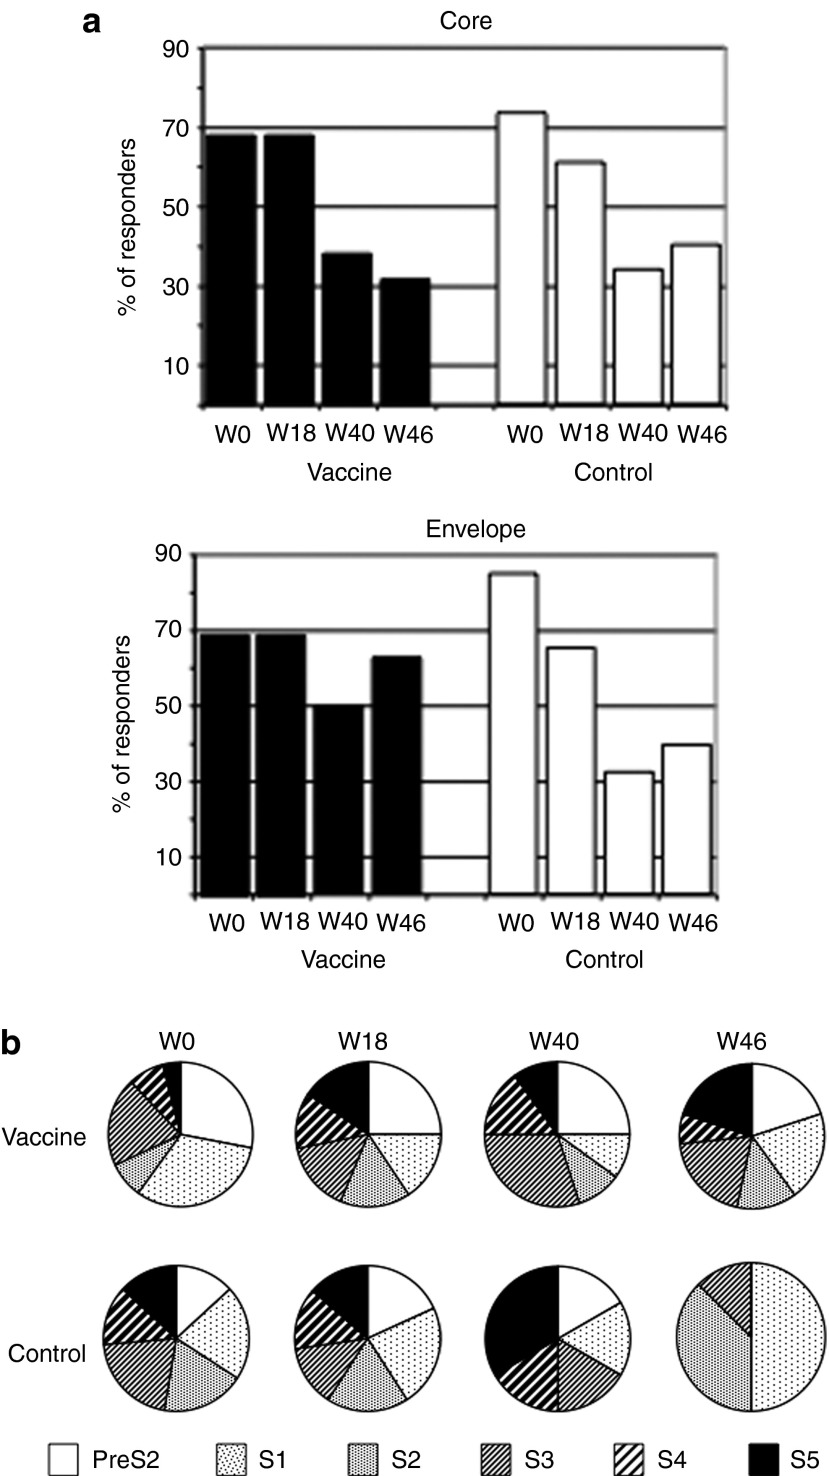
Figure 4.
Percentage of patients with T-cell responses and diversity of responses. Fresh peripheral blood mononuclear cells (PBMCs) from patients taken at different time points were stimulated with peptide pools corresponding to the hepatitis B virus (HBV) capsid (core) and envelope proteins for 10 days and interferon (IFN)-γ–secreting T cells were enumerated by an in vitro ELISpot assay. (a) Percentage of patients with positive IFN-γ ELISpot response (responders) among vaccine (n = 17; black bars) and control (n = 16; white bars) groups over time. (b) Pie charts represent the relative frequency of cells producing IFN-γ following re-stimulation with preS2 and S1-S5 envelope subpools.

