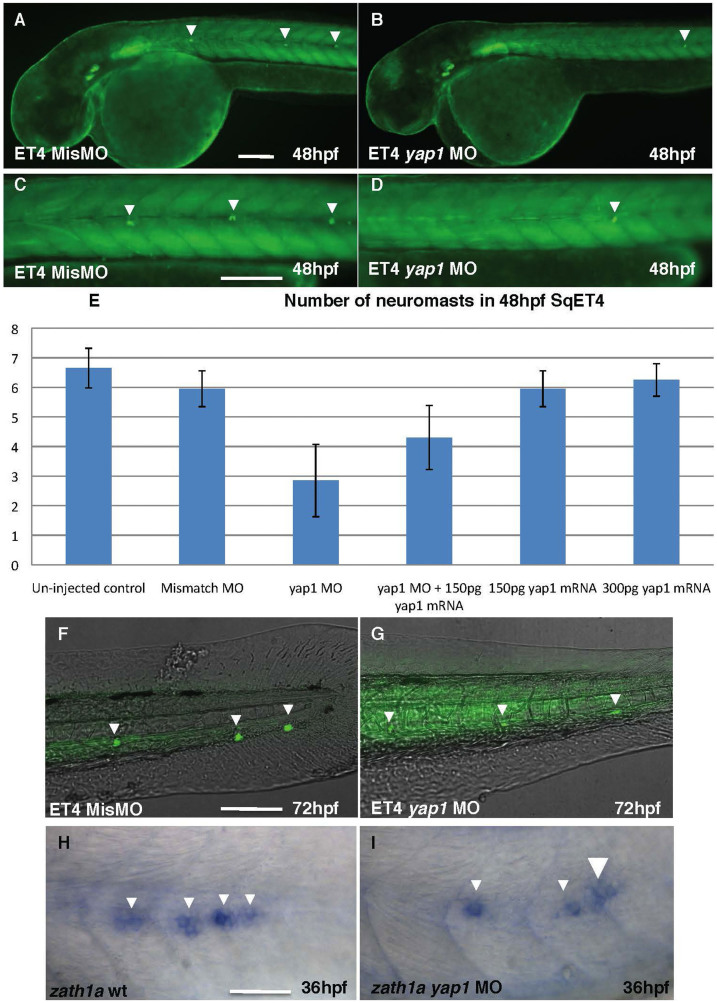
Figure 2. The number of neuromasts is reduced in yap1 SqET4 morphants.
(A), (C), (F) – controls; (B), (D), (G) – Yap1 morphants. All embryos are shown in lateral view. The table illustrates the rescue effect of yap1 mRNA coinjection. The original data are provided as a supplement. (A), (B) – head and anterior trunk, (C), (D) – intermediate trunk, (F), (G) – tail. Notice a reduction in a number of neuromast cells and increase of background due to longer exposure in (G) comparing to (F). (H), (I) – zath1a expression in the lateral line primordium of controls (H) and morphants (I). Scale bar = 40 μm, (H)&(J) = 20 μm.

