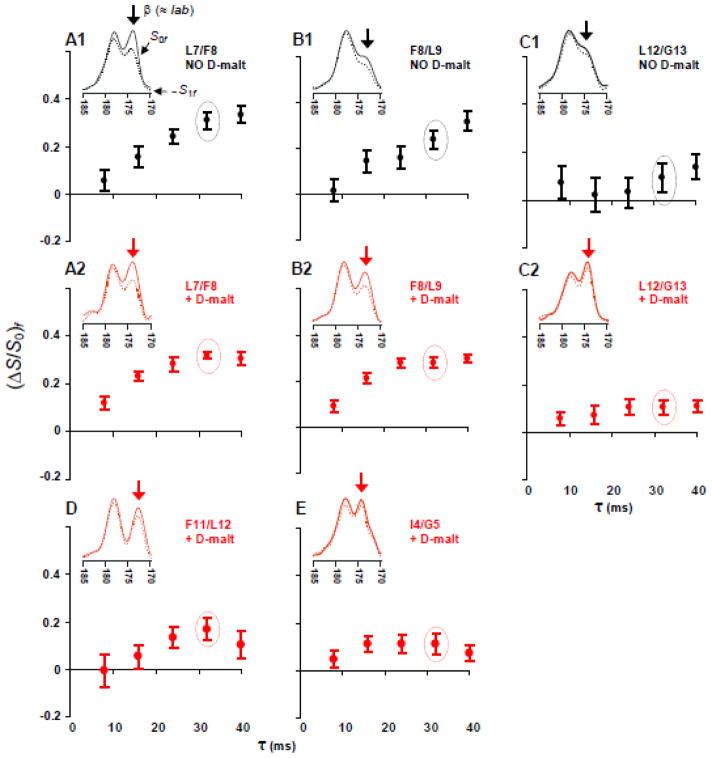
Fig. 5.
fpCTDQBU (ΔS/S0)fβ vs dephasing time τ for samples containing FP-Hairpin 13CO labeled at (A) L7, (B) F8, (C) L12, (D) F11, and (E) I4. Panels A1, B1, and C1 (black circles) are membrane samples and panels A2, B2, C2, D, and E (red circles) are membrane+D-malt samples. (A–E) Inset are experimental S0f (solid line) and S1f (dotted line) 13CO spectra for τ = 32 ms. Relative to S0f, attenuation of the S1f signal is due to 13CO-13C couplings. The (ΔS/S0)fβ are calculated using the 13CO spectral intensities integrated in a 1.0 ppm window centered at the β peak shift (denoted by an arrow). Spectral processing was typically done without line broadening and with polynomial baseline correction (see SI). Each S0f and S1f spectrum represents the sum of (A1) 15000, (A2) 12000, (B1) 12000, (B2) 11000, (C1) 14000, (C2) 12000, (D) 16000, and (E) 14000 scans.

