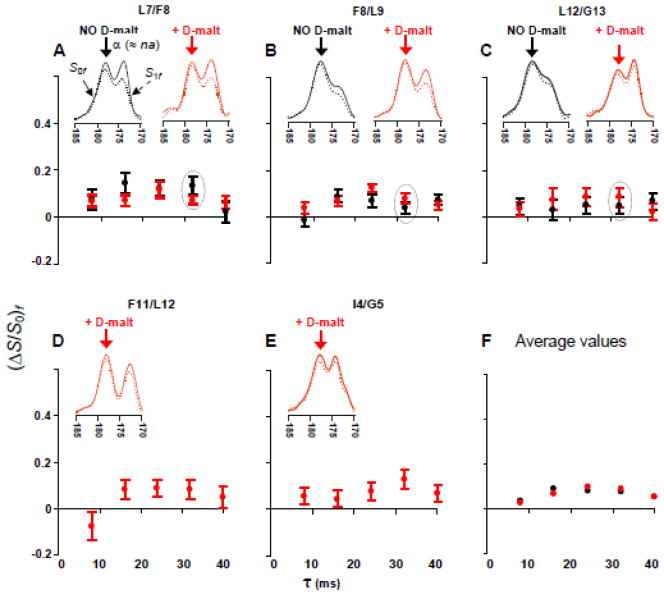
Fig. 6.
fpCTDQBU (ΔS/ S0)fα vs dephasing time for samples containing FP-Hairpin 13CO labeled at (A) L7, (B) F8, (C) L12, (D) F11, and (E) I4. Black circles are for membrane samples and red circles are for membranes+D-malt samples. Data are overlaid in panels A–C to compare samples with the same label prepared without or with D-malt. (F) The average (ΔS/S0)fα of membrane samples (black dots) or membranes+D-malt samples (red dots). (A–E) The insets are experimental S0f (solid line) and S1f (dotted line) 13CO spectra for τ = 32 ms. The (ΔS/S0)fα are calculated using the 13CO spectral intensities integrated in a 1.0 ppm window centered at the α peak shift (denoted by an arrow).

