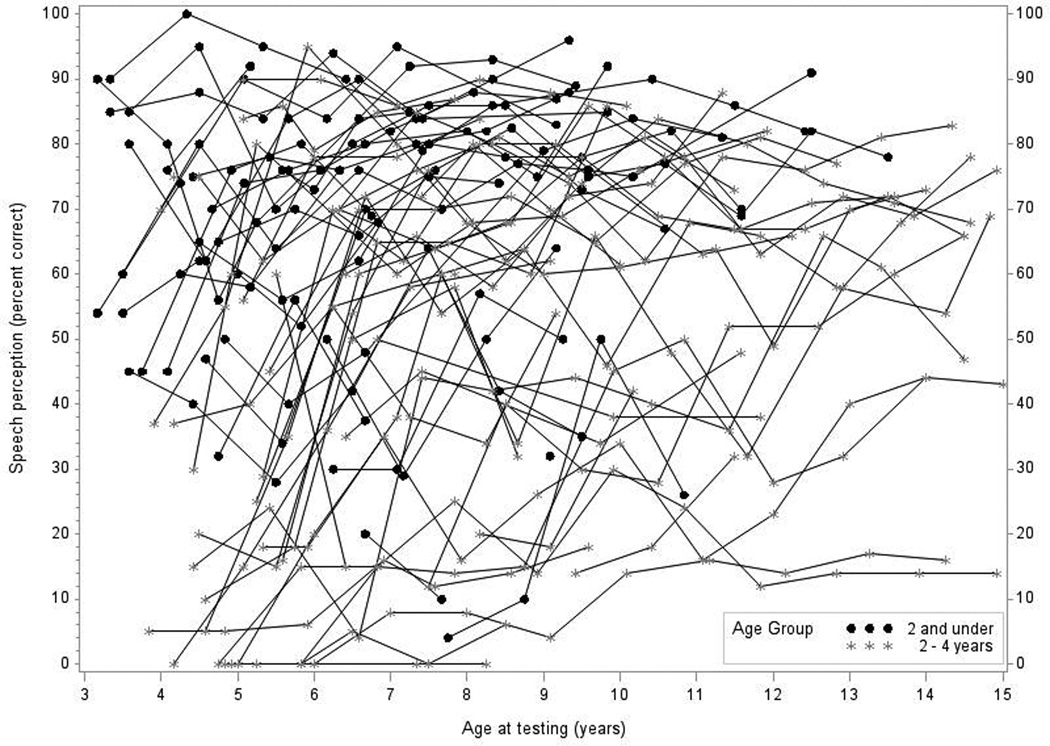
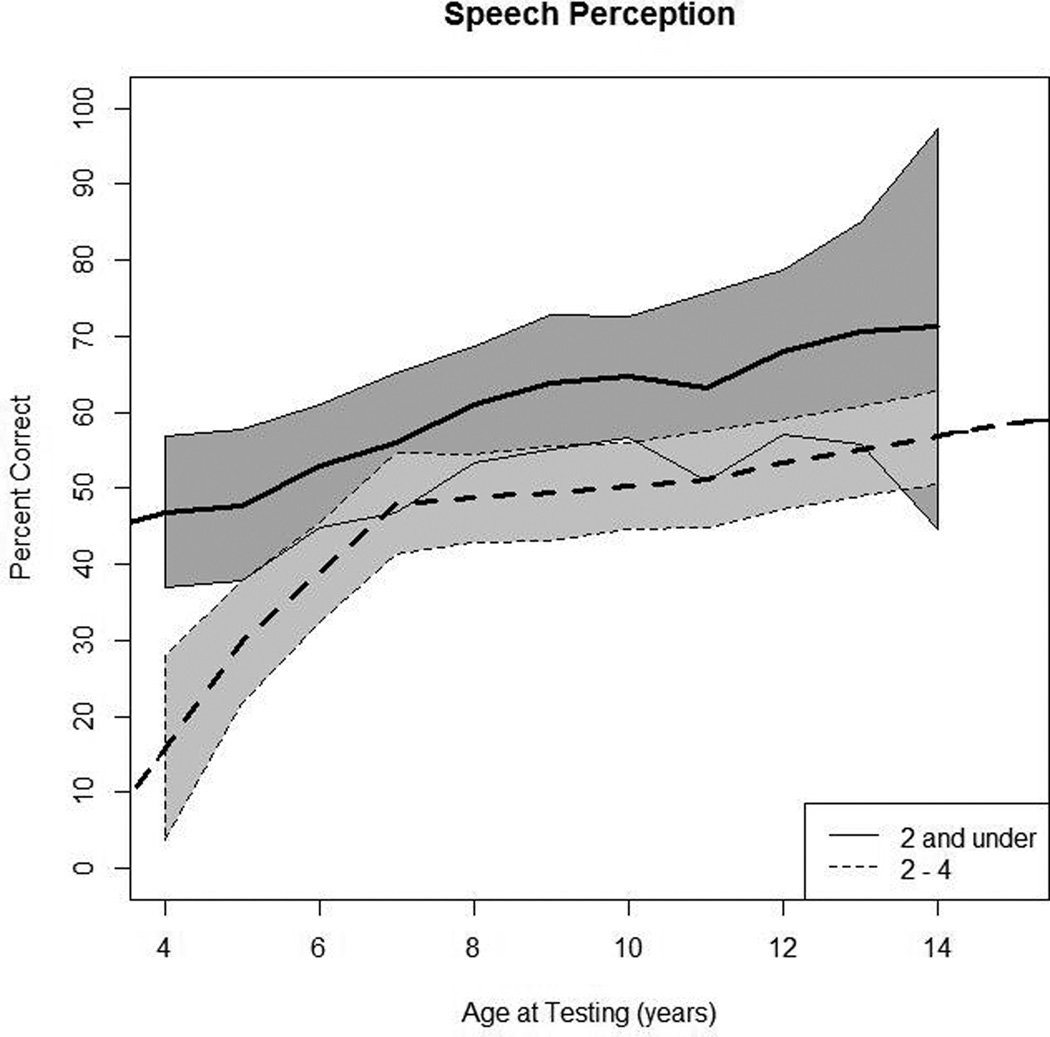
Figure 1.
In Panel 1A, raw values for speech perception are plotted over time by age at testing for the younger-implanted group and the older-implanted group. In Panel 1B, modeled values for speech perception are plotted over time by age at testing for the younger-implanted group (solid bold line) and for the older-implanted group (dashed bold line). The other lines (solid and dashed) represent the 95% confidence intervals for the two groups.


