Figure 5.

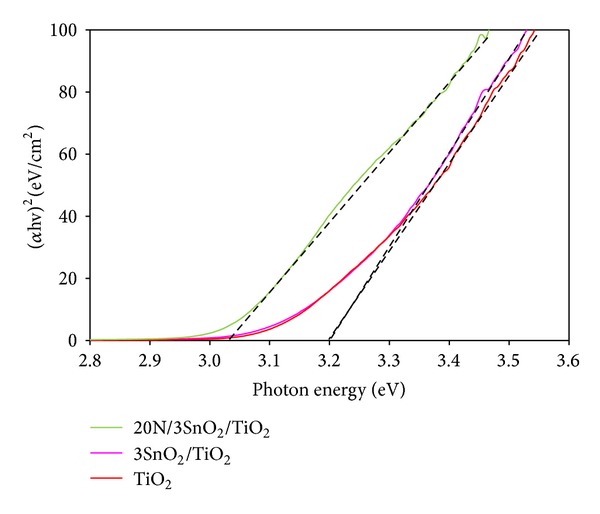
The photon energy versus (αhv)2 curve of representative pure TiO2, 3SnO2/TiO2, and 20N/3SnO2/TiO2 samples calcined at 600°C.

The photon energy versus (αhv)2 curve of representative pure TiO2, 3SnO2/TiO2, and 20N/3SnO2/TiO2 samples calcined at 600°C.