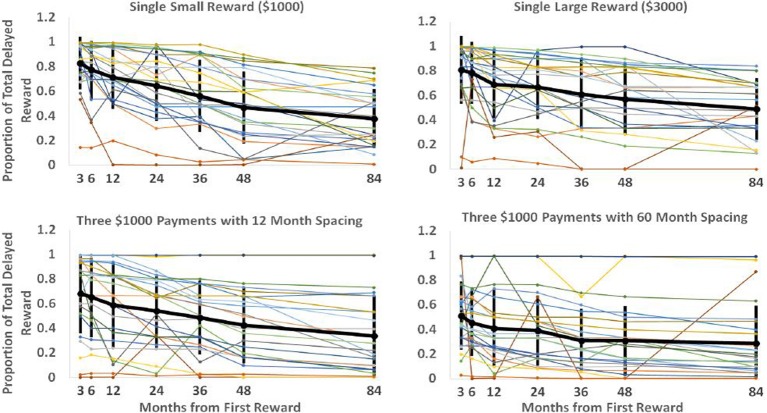
Figure 2.
Each plot displays each participant's discounting curve for a particular delayed reward schedule. The vertical axis represents the proportion of total available reward subjects would have to be given immediately for them to be indifferent between the immediate and delayed rewards. The horizontal axis represents the delay before the first reward in the sequence would be received. The black line shows the mean responses with error bars showing the standard deviation of responses for that particular spacing and onset time.

