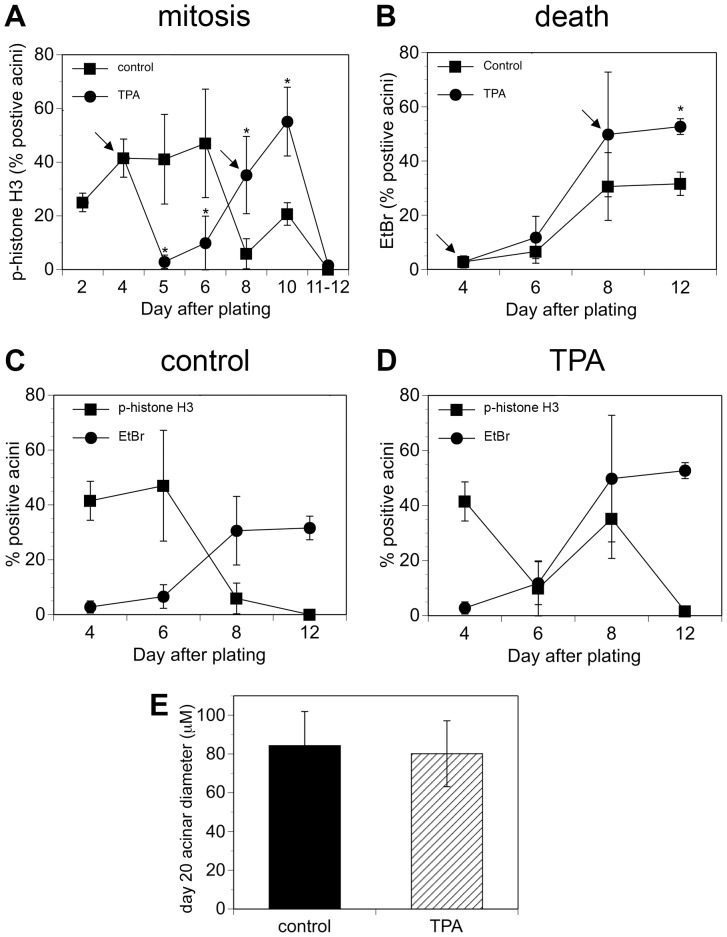
Figure 2. TPA disrupts the temporal coordination between mitosis and cell death.
Cultures of MCF10A acini were fed on days 4 and 8 (indicated by the arrows) in the absence (squares) or presence of 10 nM TPA (circles). The scoring on day 4 was conducted prior to feeding or adding TPA. The scoring on day 8 was conducted on cells that were fed in the presence or absence of TPA on day 4. The scoring for the subsequent days was conducted on cells that were fed in the presence or absence of TPA on days 4 and 8. A) On the days shown, the cultures were fixed and then stained to detect phospho-histone H3 as a marker of mitosis. Acini that were positive for at least one cell were scored as positive. On average, at least 100 acini were examined for each data point. Each point on the graph represents the average of at least three independent experiments +/− SD, except Day 11–12, which represents the average of two data points, one from Day 11 (control = 0, TPA = 1.2%) and one from Day 12 (control = 0 and TPA = 2%). B) On the days shown, ethidium bromide (EtBr) was added to the cultures; uptake of ethidium bromide was used as a marker of cell death. Acini that were positive for at least two cells were scored as positive. At least 190 acini were examined for each data point. The asterisk denotes that there is a statistically significant difference between TPA-treated cultures and control cultures (p<0.05) as determined by using a by using an unpaired t-test. Graphical representation of both mitosis (squares) and death (circles) is shown for C) control acini and D) TPA-treated acini. E) Cultures of MCF10A acini were fed on days 4, 8, 12, and 16 in the absence (control, filled bar) or presence of 10 nM TPA (hatched bar). Diameters at the widest point were measured for single acini on day 20. The average diameters (microns) +/− SD are shown (n = 200).

