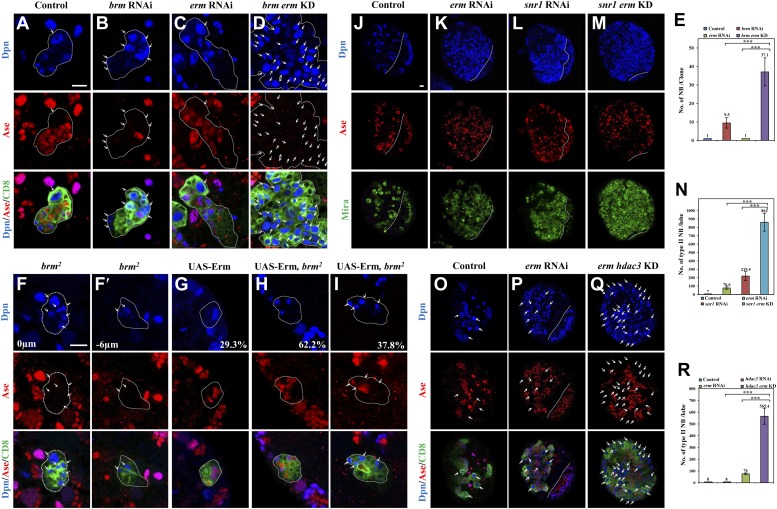
Figure 5. Brm genetically interacts with Erm to prevent dedifferentiation of INPs to neuroblasts.
(A–D) Type II clones of control (the type II driver; A), brm knockdown (B), erm knockdown (C) and brm erm double knockdown (D) were labeled with Dpn (blue), Ase (red) and CD8 (green). (E) Quantifications of neuroblast number per type II neuroblast lineage for A–D. (F–I) Type II MARCM clones of brm2 (F, F′), UAS-Erm (G) and UAS-Erm, brm2 (H–I) were labeled with Dpn (blue), Ase (red) and CD8 (green). (J–M) Larval brains of control (J, elav-Gal4 driver), erm knockdown (K), snr1 knockdown (L) and erm snr1 double knockdown (M) were labeled with Dpn (blue), Ase (red) and Mira (green). (N) Quantifications of the number of type II neuroblasts per brain hemisphere in various genotypes in J–M. Control (elav-Gal4), 7 ± 0; erm RNAi, 76.6 ± 14.2; snr1 RNAi, 219.5 ± 52.2; erm snr1 double knockdown (KD), 862.0 ± 106.7. (O–Q) Larval brains of control (driver; O), erm knockdown (P) and erm hdac3 double knockdown (Q) under the type II driver were labeled with Dpn (blue), Ase (red) and CD8 (green). (R) Quantifications of neuroblast number per brain hemisphere in O–Q. Central brain is to the left of white dotted lines. Arrows indicate neuroblasts. Clones were indicated by white dotted lines. Scale bars, 10 µm. *** indicates p<0.001.


