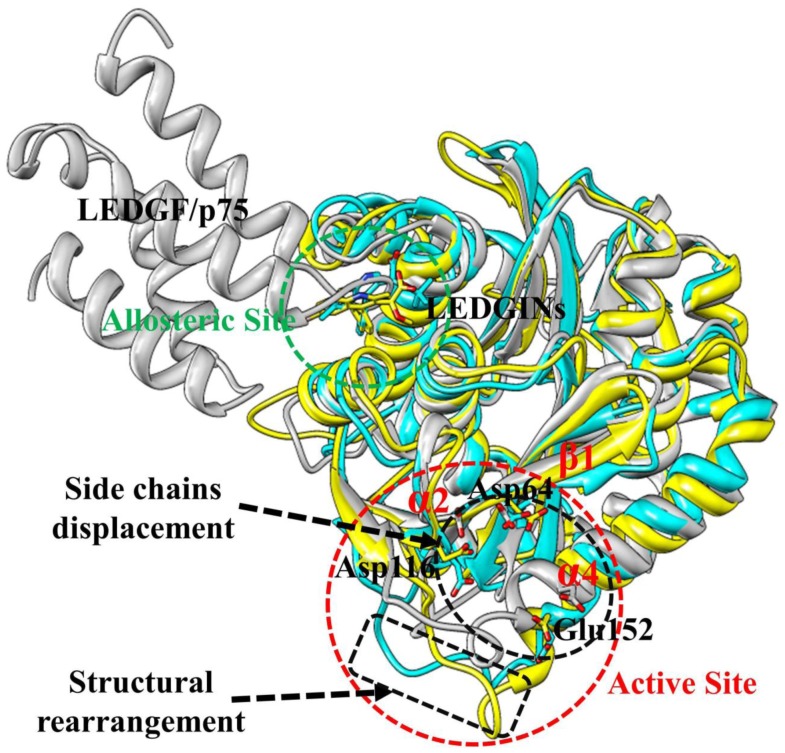
Figure 9. Structural model of LEDGF/p75 in complex with HIV-1 IN CCD dimer.
The averaged structure extracted from the MD trajectory was used. The protein is shown in cartoon representation with two monomers in yellow and cyan. The side chains of the LEDGF/p75 amino acids are shown as gray sticks. Hydrogen bond interactions are denoted by dotted green lines.

