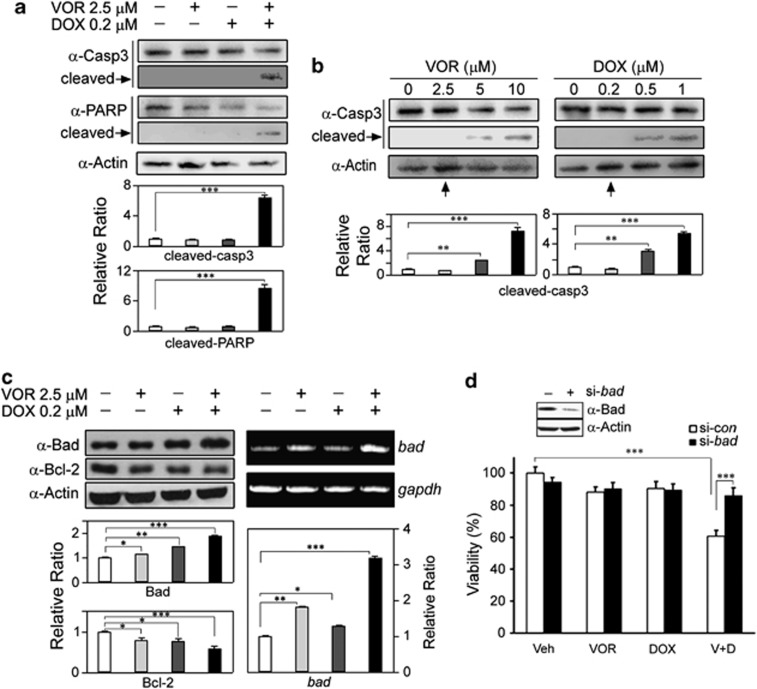
Figure 2.
Typical apoptotic markers, such as cleaved caspase-3 and poly (ADP-ribose) polymerase (PARP), are induced by the co-treatment, which is correlated with Bad upregulation. (a) HeLa cells were treated with 2.5 μM VOR and/or 0.2 μM DOX, and the activation of caspase-3 and PARP was assessed using a western blot analysis. Notably, each treatment alone did not induce activation of caspase-3 and PARP, whereas the co-treatment induced cleaved caspase-3 and PARP, typical apoptotic markers. The bars denote the changes in the density ratio of cleaved caspase-3 (cleaved-casp3) or cleaved PARP (cleaved-PARP) over β-actin (***P<0.001 versus vehicle; n=5). (b) HeLa cells were treated with VOR or DOX at the indicated concentrations for 16 h, and the concentrations that did not induce the cleavage of caspase-3 were determined using a western blot analysis. Notably, activation of caspase-3 was not observed until 2.5 μM VOR and 0.2 μM DOX were applied (upright arrows) (**P<0.01, ***P<0.001 versus vehicle; n=5). (c) HeLa cells were treated with 2.5 μM VOR and/or 0.2 μM DOX for 16 h, and the upregulation of Bad and downregulation of Bcl-2 were observed using a western blot analysis (left panels). Additionally, the transcript level of bad was assessed with reverse transcriptase-PCR using gapdh as a normalization control (right panels) (*P<0.05, **P<0.01, ***P<0.001 versus vehicle; n=4). (d) HeLa cells were transfected with bad (si-bad) or scrambled (si-con) siRNA for 48 h, followed by a 16-h treatment with 2.5 μM VOR and/or 0.2 μM DOX. The effects of the co-treatment on synergistic growth inhibition were observed with the MTT assay. The knockdown of Bad in the siRNA-transfected cells was evaluated using a western blot analysis (inset). Notably, transfection with an siRNA targeting bad abrogated the synergistic growth inhibition induced by the VOR and DOX co-treatments. The same result was observed in SiHa, CaSki and U2OS cells and even in DOX-resistant MCF7 breast cancer cells (Supplementary Figure 3) (***P<0.001 versus vehicle or si-con of V±D, n=4). Veh=vehicle, V=VOR, D=DOX.

