Figure 1.
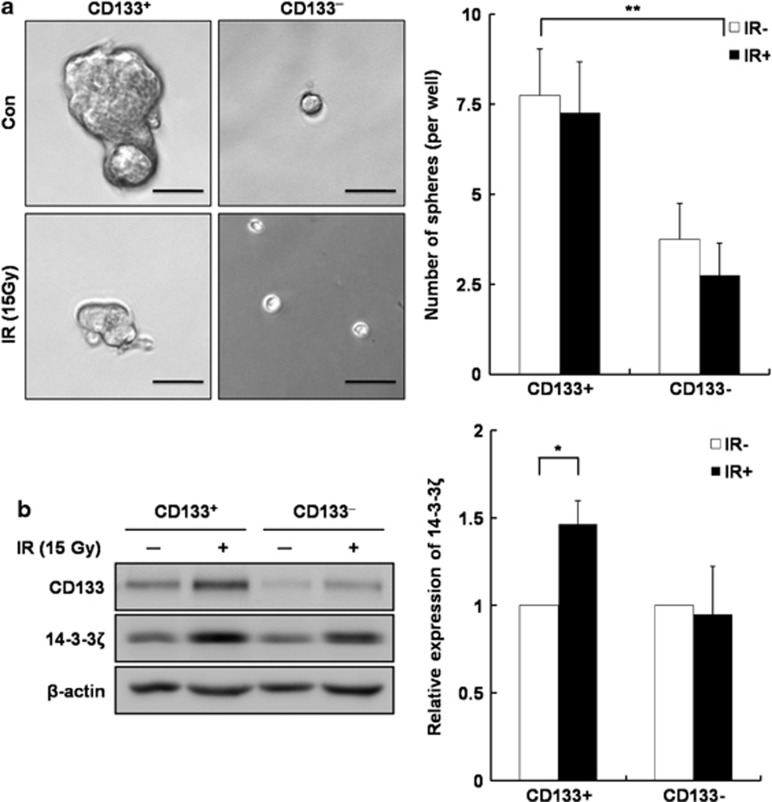
Correlation of stemness characteristics with 14-3-3ζ expression in CD133+ and CD133– hepatoma cells after γ-irradiation (IR). (a) Representative phase-contrast micrographs of tumor spheres formed in CD133+ and CD133– cells at 96 h after IR. Black bars, 50 μm. Sphere formation efficiency is represented by a quantitative analysis. The number of spheres (diameter>50 μm) from 100 cells was counted at 96 h after IR. The data are the mean±s.d of three independent experiments (**P<0.01). (b) 14-3-3ζ expression was analyzed by western blot using a 14-3-3ζ antibody in CD133+ and CD133– cells at 96 h after IR. Band densities were quantified with TINA imaging analysis software and normalized to β-actin expression. The data represent the relative density of IR and were reproduced in three independent experiments (*P<0.05). Con, control.

