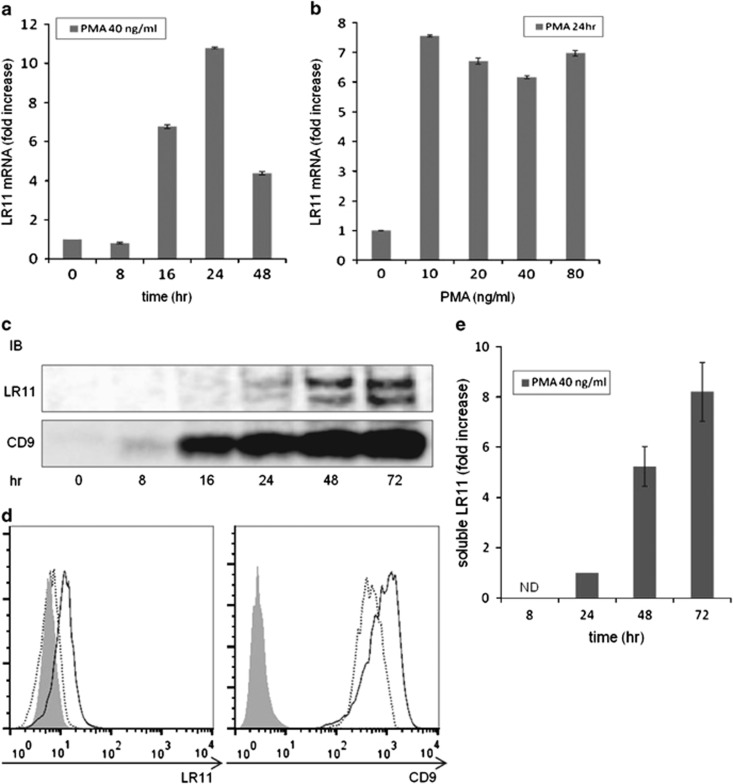
Figure 3.
Expression of LR11 and CD9 in THP-1 cells stimulated with PMA at different time intervals. (a) The levels of LR11 mRNA in THP-1 cells stimulated with 40 ng ml−1 PMA at different time intervals. (b) The levels of LR11 mRNA in THP-1 cells stimulated with varying concentrations of PMA for 24 h. The gene expression levels of LR11 were determined by quantitative real-time PCR. Data are shown as the fold increase relative to the control (0 h or PMA 0 ng ml−1) and presented as the mean±s.d. (error bars, n=3). (c) The protein expression levels of LR11 or CD9 in THP-1 cells stimulated with 40 ng ml−1 PMA at different time intervals were analyzed by western blot analysis. (d) The cell surface expression levels of LR11 or CD9 in THP-1 cells stimulated with 40 ng ml−1 PMA for 24 h (dashed line) or 72 h (solid line) were evaluated by flow cytometry. Gray-colored histograms represent cells labeled with an isotype control antibody. (e) The concentrations of sLR11 released from THP-1 cells stimulated with 40 ng ml−1 PMA at different time intervals were determined by ELISA. Data are shown as the fold increase relative to the 24 h time point and presented as the mean±s.e. (error bars, n=3). ND, not detected. In all cases, the cells were cultured with fresh serum-free media.

