Figure 7.

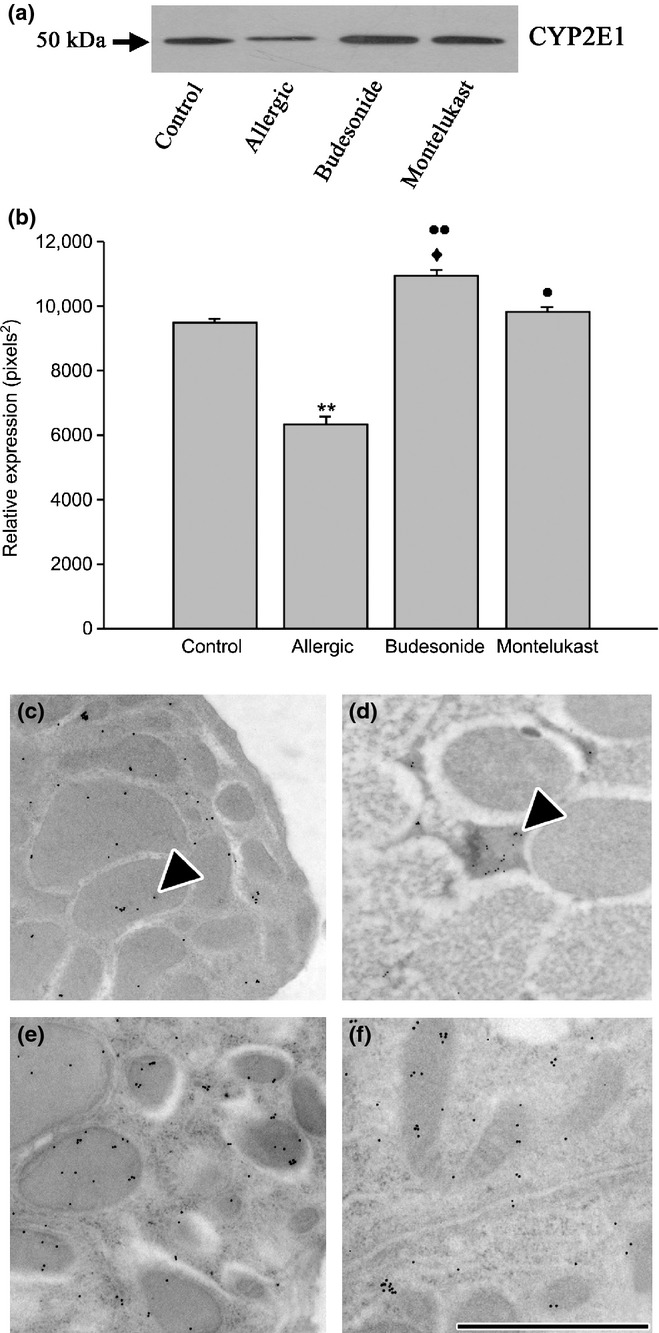
Analysis of CYP2E1 in chronic allergy: expression by Western blot (a and b) and by inmunoelectron microscopy (c–f). Western blot analysis of lung homogenate showed a decrease in CYP2E1 expression that was demonstrated to be significant (**P < 0.01). Analysis also evidenced that both budesonide (BUD) and montelukast (MK) treatments increased significantly the cytochrome expression (••P < 0.01 and •P < 0.05 respectively), but BUD reached values higher than MK (♦P < 0.05). CYP2E1 labelling by immunogold in control group showed abundant mitochondria and immunostained for the cytochrome (c); in contrast, chronic allergy produced few and small mitochondria, which were positive for CYP2E1 (d); while CYP2E1 immunostaining confirmed that the cells recovered their numerous mitochondria (arrowheads) immunolabelled for this cytochrome in BUD (e) and MK group (f). Bar represents 1 μm.
