
Figure 1.
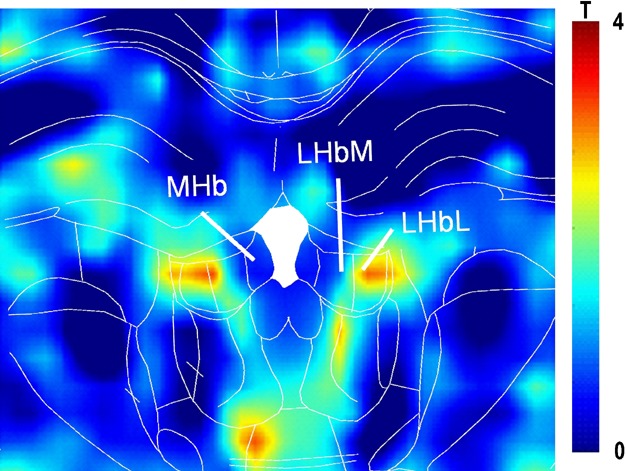
An example of ‘genetic imaging’.This map shows differences in regional cerebral blood volume (rCBV; a voxel-by-voxel based statistic was performed and is shown as a T-map) of two groups of genetically different animals (cLH: n = 8 and cNLH: n = 7). Significant alterations of rCBV within the lateral part of the LHb (acquired in vivo with a 9.4 T magnetic resonance scanner) are shown. LHbM—lateral habenula, medial part; LHbL—lateral habenula, lateral part; MHB—medial habenula.