. 2013 Jul 4;5(8):1180–1195. doi: 10.1002/emmm.201202034

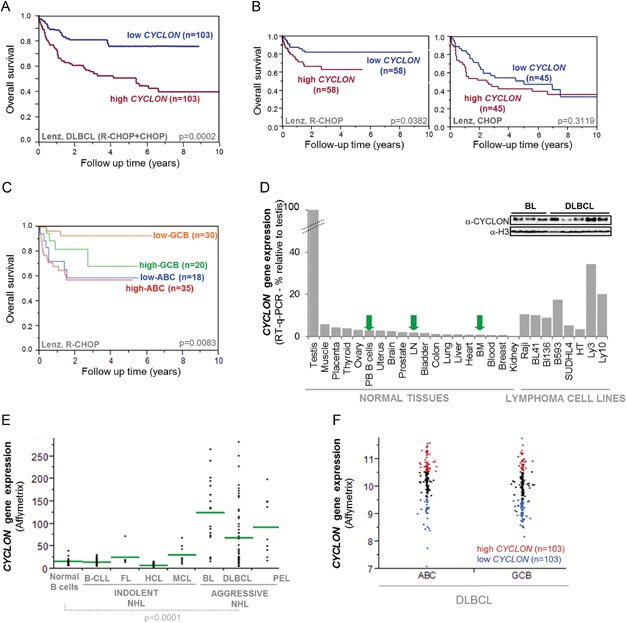
Figure 2.

Figure 2

CYCLON overexpression is a feature of aggressive NHL and correlates to adverse clinical outcome in DLBCL
  1. Kaplan–Meier cumulative survival curves in DLBCL patients from GEO GSE10846 (Lenz et al, 2008) according to CYCLON expression level (high: above 3rd quartile and low: below 1st quartile, respectively), p values from log-rank test.
  2. Survival curves according to CYCLON expression levels in DLBCL patients treated by Rituximab-CHOP (left panel, R-CHOP) or CHOP alone (right panel), p-values from log-rank test.
  3. Survival curves according to CYCLON expression levels in ABC or GCB DLBCL patients treated by Rituximab-CHOP, p-values from log-rank test.
  4. RT-qPCR and western blot (upper panel) analysis of CYCLON expression in normal lymphoid and non-lymphoid tissues, and in lymphoma lines, as indicated: PB B: peripheral blood B cells, LN: lymph node, BM: bone marrow, n = 3.
  5. Affymetrix-derived CYCLON gene expression values for individual patients from GEO GSE2350 (Basso et al, 2005), p-value from Wilcoxon test (E) and GEO GSE10846 (Lenz et al, 2008) (F).