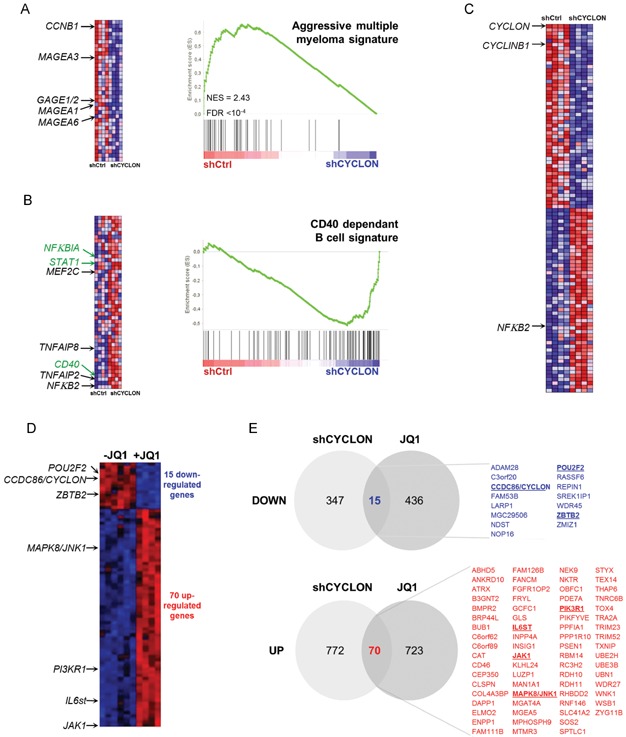
Figure 4.

- Gene Set Enrichment Analysis (GSEA) enrichment plots obtained from gene expression data from CYCLON knockdown Raji cells (shCYCLON, n = 4) compared to control Raji cells (shCTRL, n = 4) with associated heat-maps (left). GSEA enrichment plots show down-regulation of aggressive multiple myeloma signature (A) and up-regulation of a CD40-dependent B-cell signature (B) in CYCLON knock-down compared to control Raji lymphoma B cells. Genes are ordered on the x axis by their differential expression score (each vertical line representing a gene).
- Top 50 genes up-regulated (red) or down-regulated (blue) upon CYCLON knockdown (shCYCLON) in Raji lymphoma B cells compared to control (shCtrl). Gene sets are from MSIGDB collection. See the Materials and Methods section and supplementary material for detailed data analysis.
- Venn diagram showing the overlap between differentially expressed genes upon CYCLON knockdown and JQ1 treatment in Raji cells (data from GSE29449, Mertz et al, 2011) and list of commonly down- and up-regulated genes. Black and green arrows: genes cited in text. Green arrows refer to genes commonly regulated by CYCLON and JQ1 within the CD40 signature.
