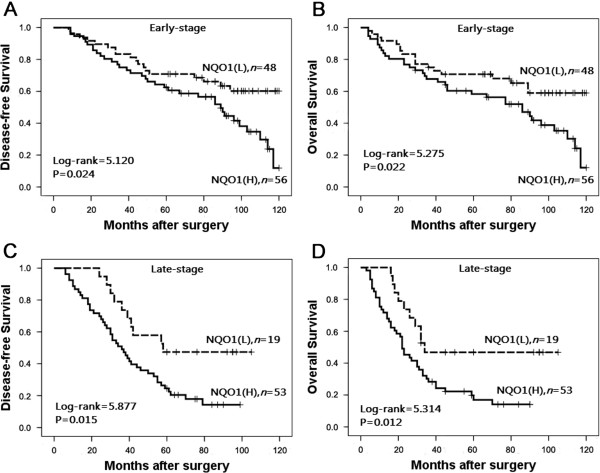
Figure 5.

Kaplan–Meier survival curves of in early and late stage patients. (A) and (B) show comparison of DFS and 10-year OS, respectively, in NQO1 (L) and (H) patients of early stage. (C) and (D) show comparison of DFS and 10-year OS, respectively in NQO1 (L) and (H) patients of late stage.
