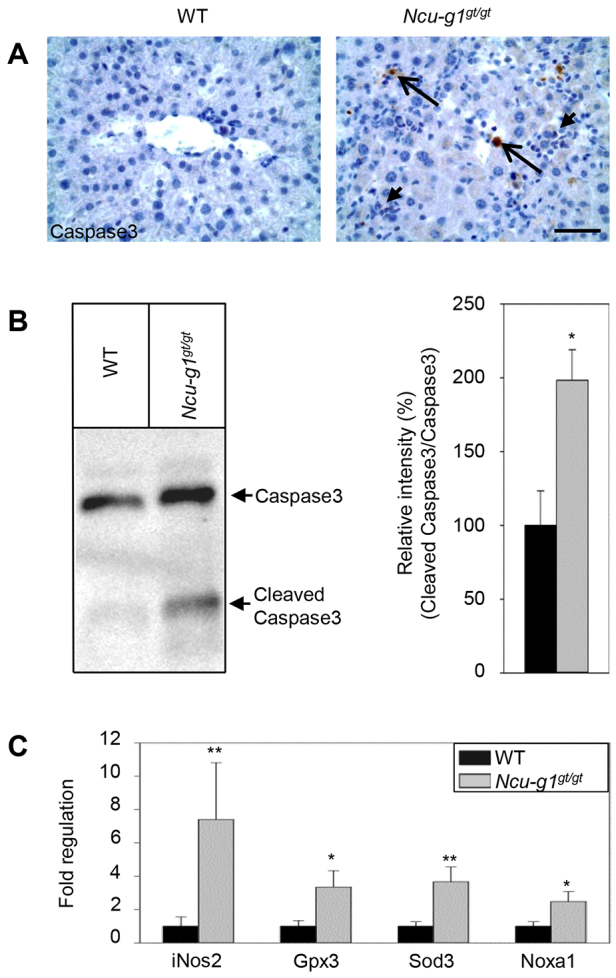
Fig. 4.

Increased rate of cell death and oxidative stress in Ncu-g1gt/gt liver. (A) Liver sections labeled for active caspase 3 and counterstained with Mayer’s hematoxylin indicate apoptosis (long arrows) and inflammation (short arrows) in Ncu-g1gt/gt mice. Scale bar: 50 μm. (B) Representative western blot showing caspase 3 expression in wild-type (WT) and Ncu-g1gt/gt liver. The levels of active caspase 3 were significantly higher in Ncu-g1gt/gt liver homogenates (n=4, *P<0.05). (C) Expression of genes involved in oxidative stress (iNos2, Gpx3, Sod3, Noxa1) were elevated in Ncu-g1gt/gt liver (n=4, *P<0.05, **P<0.005). Values are expressed as mean±s.e.m.
