
Figure 2.
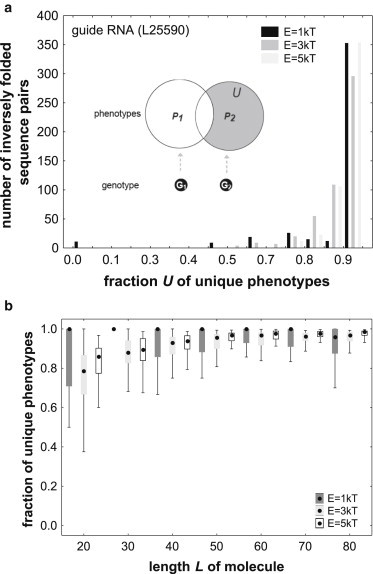
Different genotypes with the same native phenotype differ greatly in the phenotypes of their plastic repertoire. The figure shows data about the plastic repertoires of two genotypes G1 and G2 with the same native phenotype P. These plastic repertoires are indicated by circles in the inset of panel (a). Specifically, the figure displays the fraction U of phenotypes that are in the plastic repertoire P2, of G2, but not in P1, of G1, as indicated by the gray shaded region of the inset. (a) the distribution of U for 500 inversely folded sequence pairs with a predicted mfe structure identical to that of the guide RNA (L = 40nt; Genbank Acc. No. L25590) from Table S1. The distribution is shown for three different energy intervals E, as indicated in the right inset. Note that for most sequence pairs, U is close to 1, meaning that most phenotypes in the plastic repertoire of one sequence are unique. (b) Box plot of U for random sequences of different lengths (horizontal axis) and different energy intervals (inset). For each length value, data are based on 10 random RNA sequences that fold into a secondary structure phenotype, and for 5 inversely folded sequence pairs for each phenotype, i.e., for 50 sequence pairs in total. Black dots indicate medians, boxes span the 25th to 75th percentile of the distribution, and whiskers indicate the nonoutlier range (see Methods). A median of U = 1 indicates that for more than half of all sequence pairs, the plastic repertoires do not share a single structure.