
Figure 3.
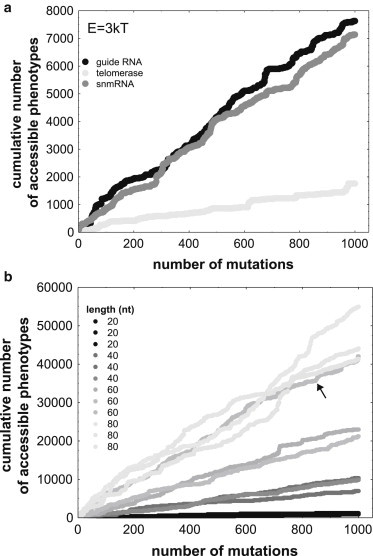
New accessible phenotypes accumulate at a nondecreasing rate. The horizontal axes show the number of steps along a random walk of 1000 steps on a genotype network. The vertical axes show the cumulative number of phenotypes that become accessible through phenotypic plasticity during the random walk. (a) Cumulative accessible phenotypes during one random walk each for three biological molecules that are part of a guide RNA (Genbank Acc. No. L25590), a telomerase fragment (Acc. No. AF061109), and a snmRNA (Acc. No. AJ430256, Table S1), all taken from fRNAdb (http://www.ncrna.org/frnadb, (41)). (b) Cumulative accessible phenotypes during 12 random walks for random starting genotypes with an arbitrary phenotype. Specifically, data are shown for starting genotypes in four different length categories (see legend), and for three random starting genotypes (with three different phenotypes) in each category. All data are shown for the energy interval E = 3kT.