
Figure 4.
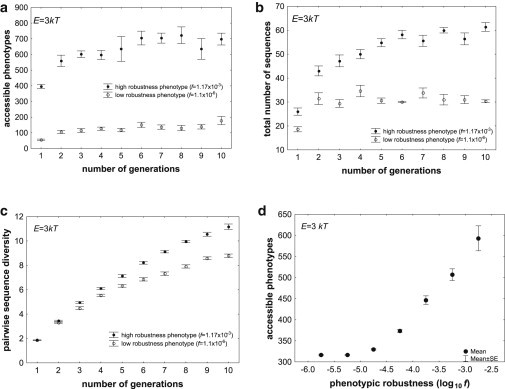
Phenotypic robustness entails access to more novel phenotypes through plasticity. (a)–(c): The horizontal axes show time in generations (mutation-selection cycles). The vertical axes show (a) the total number of unique phenotypes accessible to at least one individual in an entire population through plasticity, (b) the total number of sequences in the population, and (c) the pairwise nucleotide diversity, i.e., the number of nucleotides differing between sequence pairs, averaged over all pairs of sequences in the population. All data are based on populations of size N = 100 individuals, with a mutation rate of μ = 1 nucleotides per generation, where selection was required to preserve the native phenotype of each individual. Each population started out with identical genotypes of L = 30 nucleotides that folded into the same native phenotype. The fraction of genotype space occupied by sequences folding into that phenotype is given by the value of f in the inset. The number of accessible phenotypes is shown for the energy interval E = 3 kT. Circles indicate means over five replicate populations starting from the same genotype. Whiskers indicate one standard error of the mean. (d) Association between phenotypic robustness (log10(f), horizontal axis) and phenotypes accessible through plasticity (vertical axis), based on more than 38,000 RNA phenotypes of L = 30, and on at least three replicate evolving populations per phenotype, where each population had N = 100 members and a mutation rate of μ = 1 nucleotides per generation.