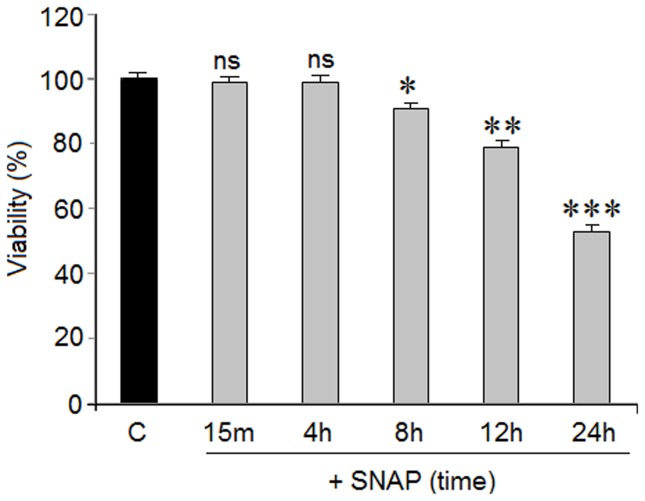
Figure 2. Action of 1.
Cortical neurons were exposed to 1±SEM of two experiments from cells of different cultures, each one performed in triplicate with different batches of cells (total 6 measurements/condition). Statistical significances were performed with respect to the basal values. ns = no significant, * = p<0.05, ** = p<0.01 and *** = p<0.001

