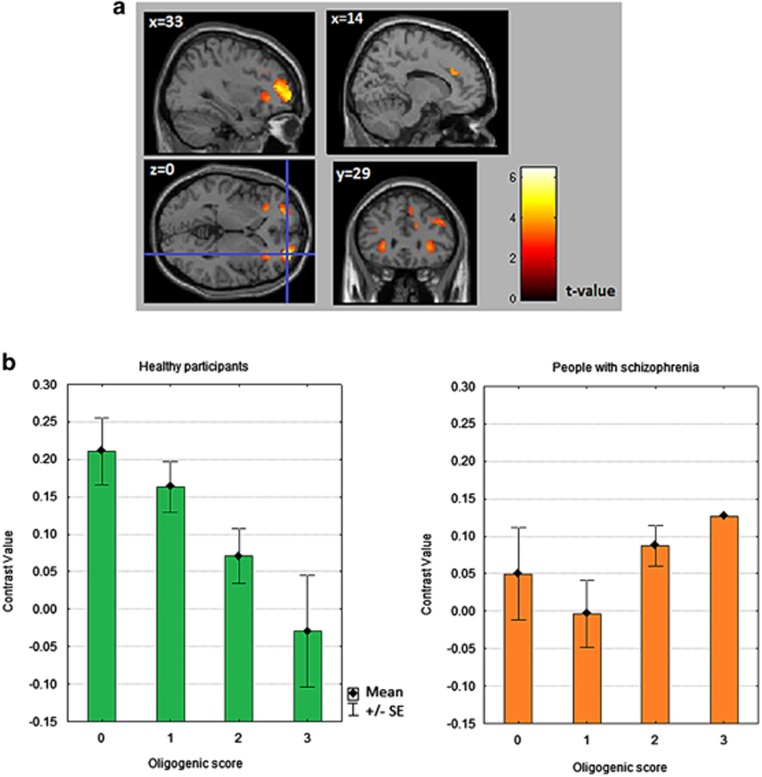
Figure 1.
Regions showing significant activation in the healthy adults during performance of the emotional go/no-go test. (a) The contrast shown reflects inhibition of responses to negative stimuli versus neutral stimuli in the middle frontal gyrus (Brodmann area (BA) 10), the right dorsolateral prefrontal cortex (BA 9), the right supplementary motor area and the right insula. A detailed overview of the activation clusters is presented in Supplementary Data 3. (b) The bar graphs illustrate the differential effect of oligogenic score on the brain activity in healthy controls and in people with schizophrenia relative to comparison group in one of the ROIs (right BA 10). Bar graphs for the additional ROIs showing a linear relationship between oligogenic score and brain activation are provided in Supplementary Data 4.

