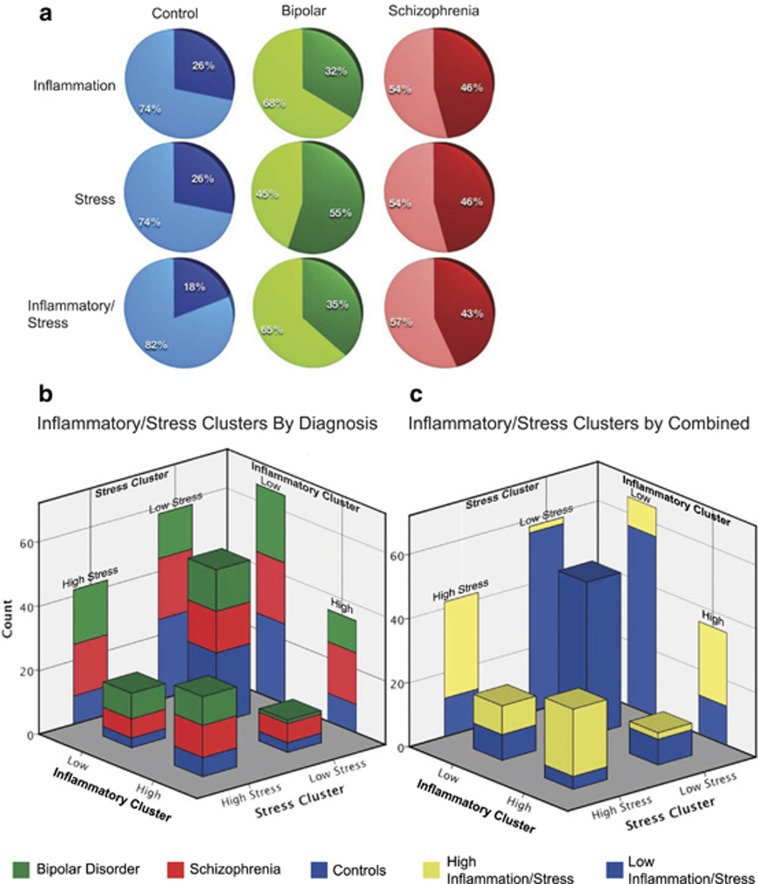
Figure 2.
A series of recursive two-step cluster analyses yields different breakdowns in each diagnosis category. Three clustering operations were performed on only the inflammatory-related genes ((a), top row), stress-related genes ((a), middle row) and then both sets of genes combined ((a), bottom row). Each diagnosis is split between those in the high group ((a), darker color) and the low group ((a), lighter color). Controls (blue), bipolar disorder (green) and schizophrenia (red) are shown in the first, second and third columns, respectively. To examine the overlap of the inflammation ((b), x axis and right rear wall) and stress clusters ((b), z axis and left rear wall) with respect to diagnosis (blue, green and red color scheme), they were plotted in the form of a three-dimensional bar graph. Using the same values as b, the third, combined stress and inflammation cluster is represented by a separate color code, with blue representing low inflammation/stress and yellow high inflammation/stress (c). This indicates that the dichotomous group variables of inflammation and stress are a good, but not perfect, predictor of membership in the combined inflammation/stress group defined by clustered by the 19 continuous mRNA values.

