
Figure 4.
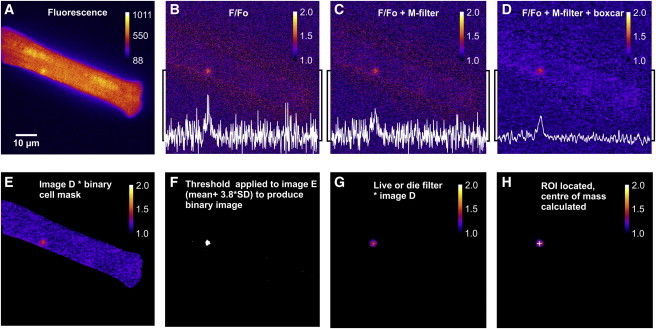
Image processing and spark detection. (A) Original fluorescence image of a fluo-4-loaded myocyte, showing a single spark event close to the lower edge. (B) F/F0 image obtained by dividing image A by the user-selected normalizing image (not shown). Increased noise is apparent immediately outside the cell boundary. The line profile passing through the center of mass of the spark (white trace) shows the amplitude of the spark relative to the background noise. (C) Application of the M filter attenuates noise outliers. (D) The boxcar filter markedly reduces the background noise. (E) Multiplication of the filtered F/F0 image by the binary cell mask (see Fig. 4) sets all pixel values outside the cell boundary to zero, thereby excluding them from subsequent analysis steps. (F) User-defined threshold (θ = mean + ε ×; see Fig. 1) applied to image E to produce a binary image, identifying spark. (G) The live-or-die filter was applied to a speckled binary image to produce a uniform ROI (above threshold = 1; otherwise, 0), and then multiplied by image E to fill the ROI with pixel values. (H) ROI located in the image. Center of spark mass coordinates were calculated and marked with a cross. To see this figure in color, go online.