
Figure 1.
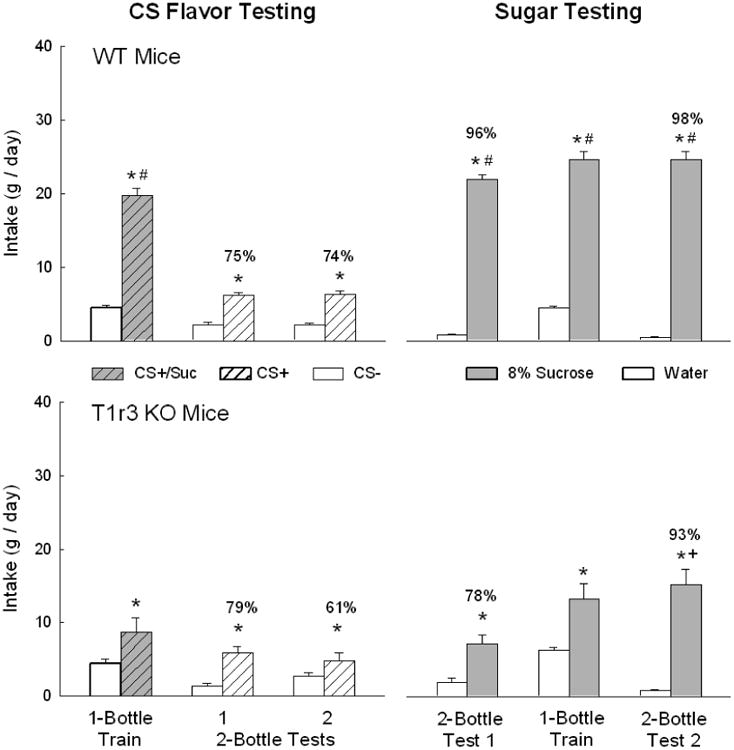
Mean (+sem) 24-h intakes of CS+/Suc and CS- in one-bottle training sessions and CS+ and CS- in two-bottle tests 1-2 (left panels) and of unflavored 8% sucrose and water in two-bottle tests 1-2 and one-bottle training days (right panels) of WT mice (top panels) and T1r3 KO mice (lower panels). Number atop bar represents mean percent preference for the CS+ or sucrose solution. An asterisk indicates a significant difference (P < 0.05) between the data within a pair of bars (CS+/Suc vs. CS-, CS+ vs. CS-, sucrose vs. water); a plus symbol indicates a significant difference between sucrose intake and preference between Test 1 vs. 2; a hash symbol indicates a significant difference between CS+/Suc or sucrose intake between WT and KO mice.