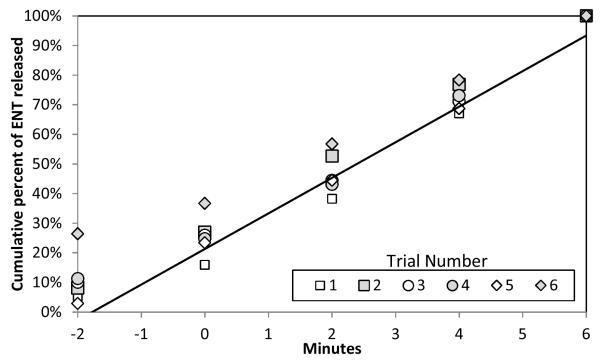
Figure 5. Percentage release of total enterococci released from the sand, normalized by the total number of released enterococci in the first 6 minutes.
In this experiment ENT were observed to have a linear release from the sand as shown by the data points on the graph. The time “−2” represents the sampling before the initiation of waves but after the seeded sand had been fully inundated with water. The percent was calculated as the total number of bacteria released in the first 6 minutes, divided by the total number of bacteria released at 2-minute intervals.

