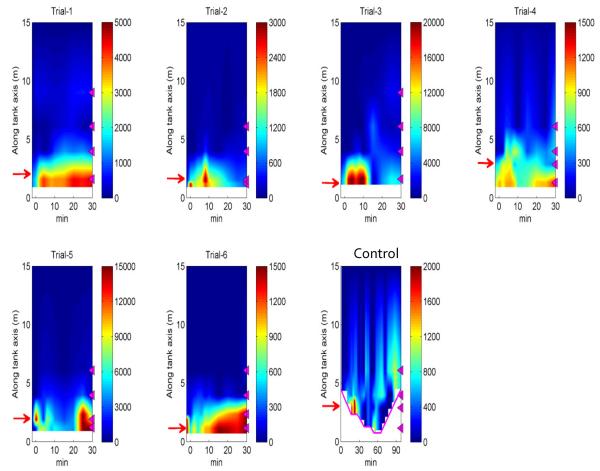
Figure 6. Gross release of enterococci for the entire 30-minute trial.
Contours of enterococci concentrations (unit of color bar scale: CFU/100 mL) in the flume water using linear interpolation between sampling locations. The magenta triangles on the right of each panel illustrate the water sampling locations. Red arrows indicate locations of seeded sand strip. The magenta line in the “no wave” control trial shows the location of waterline.

