
Figure 7. Percent released for wave flume trials and percent released for corresponding shearing assays.
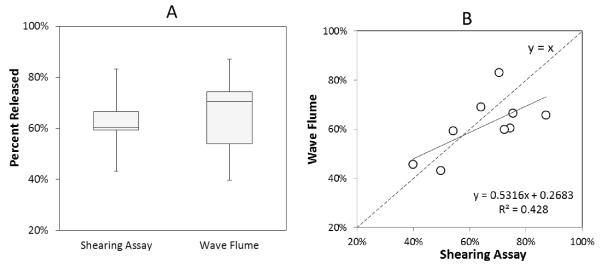
A. The percent released is similar between the shearing assay and wave flume for all trials. Mean is displayed as an X on each box. There was no statistical difference between the two data sets (p=0.6) B. Dotted line represents a theoretical 1:1 relationship between the percent released in the wave flume and percent released in the shearing assay. The solid line represents the linear regression for the observed relationship. The linear regression from the data is not statistically dissimilar from a 1:1 ratio and fits this theoretical 1:1 linear regression (r=0.52, p=0.08). The percentages released from sand during the wave flume and shearing assay are correlated (r=0.63, p=0.037).